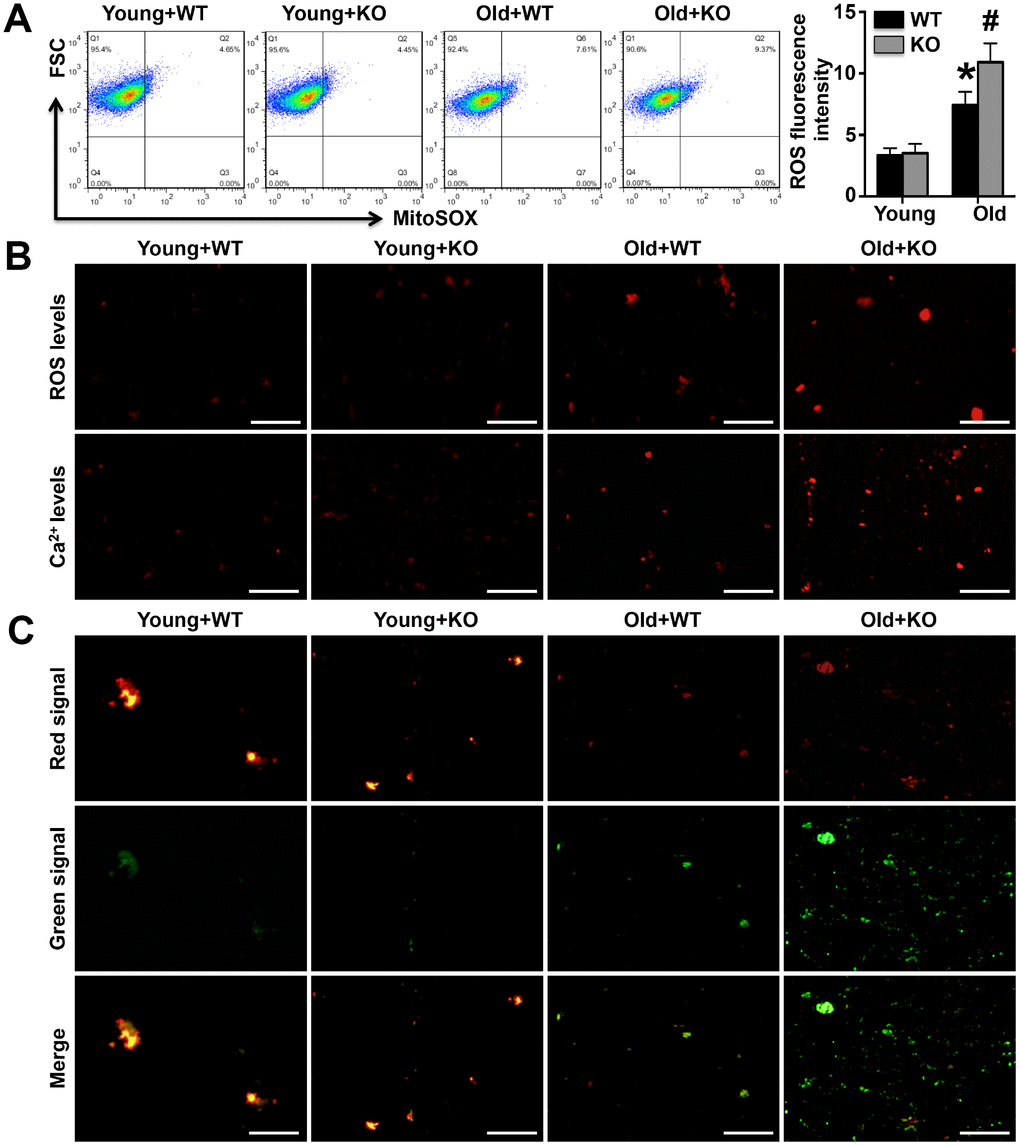
Figure 4.Mitochondrial fluorescence intensity of calcium and ROS and membrane potentials were detected. (A). The mitochondrial ROS fluorescence intensity was investigated by the Flow Cytometry analyses. (B). The MitoSOX Red Mitochondrial Superoxide Indicator probe and the Rhod-2 AM probe were used to mark mitochondrial calcium ions and ROS, respectively (400x). (C). The mitochondrial membrane potential was detected using the JC-1 probe (400x). N=5-6 for each group.