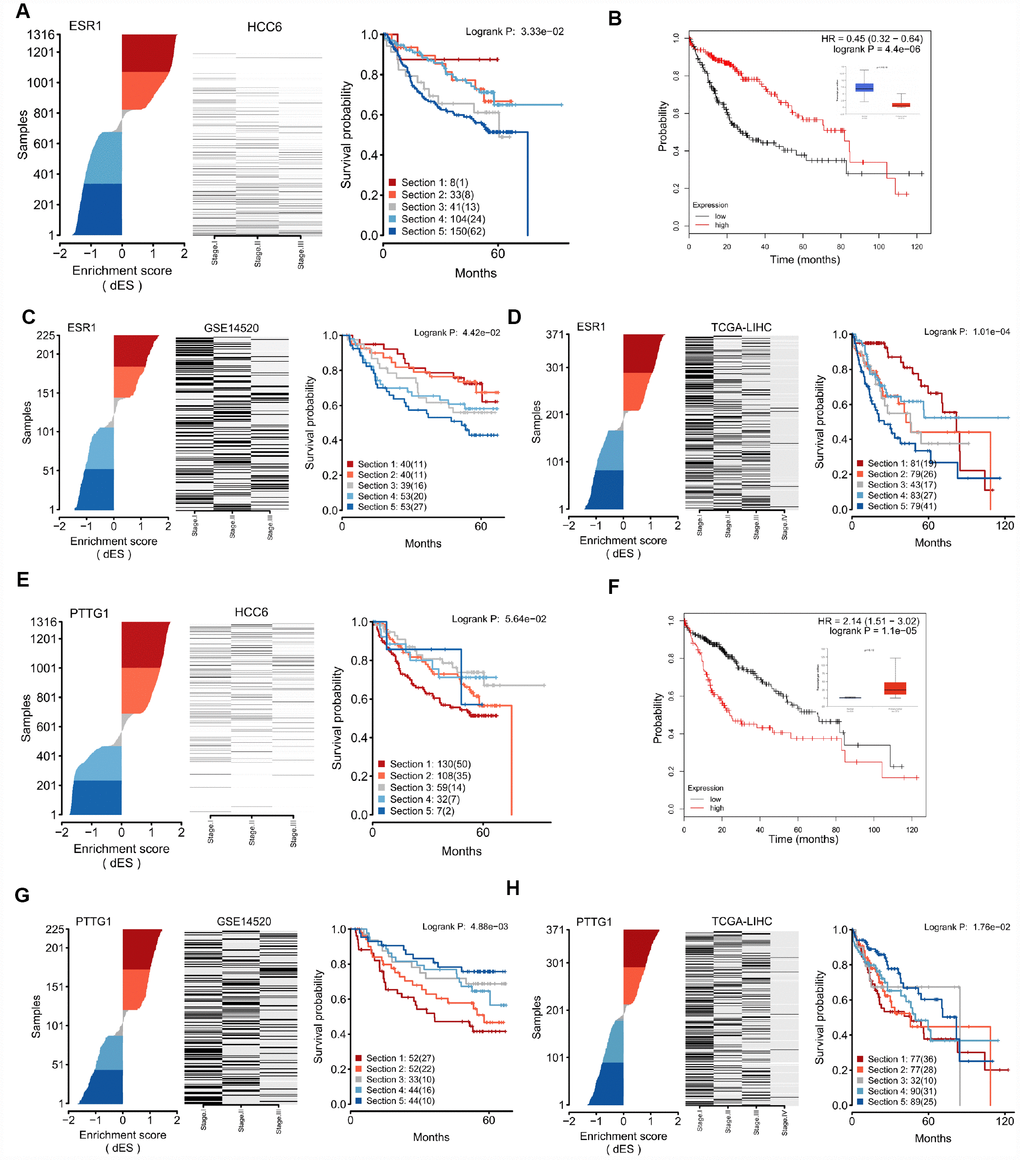
Figure 6.Regulon activity as read-out of survival outcomes. (A) dES of ESR1 calculated for all samples in the HCC6 cohort. Disease-specific survival plots for each tumor subgroup are highlighted; patient numbers are listed for each section. (B) Kaplan-Meier survival curve using ESR1 gene expression data in the LIHC cohort, generated using the KM-plotter tool [56]. (C) dES of ESR1 in the GSE14520 cohort. (D) dES of ESR1 in the LIHC cohort. (E–H) Analysis results for PTTG1.