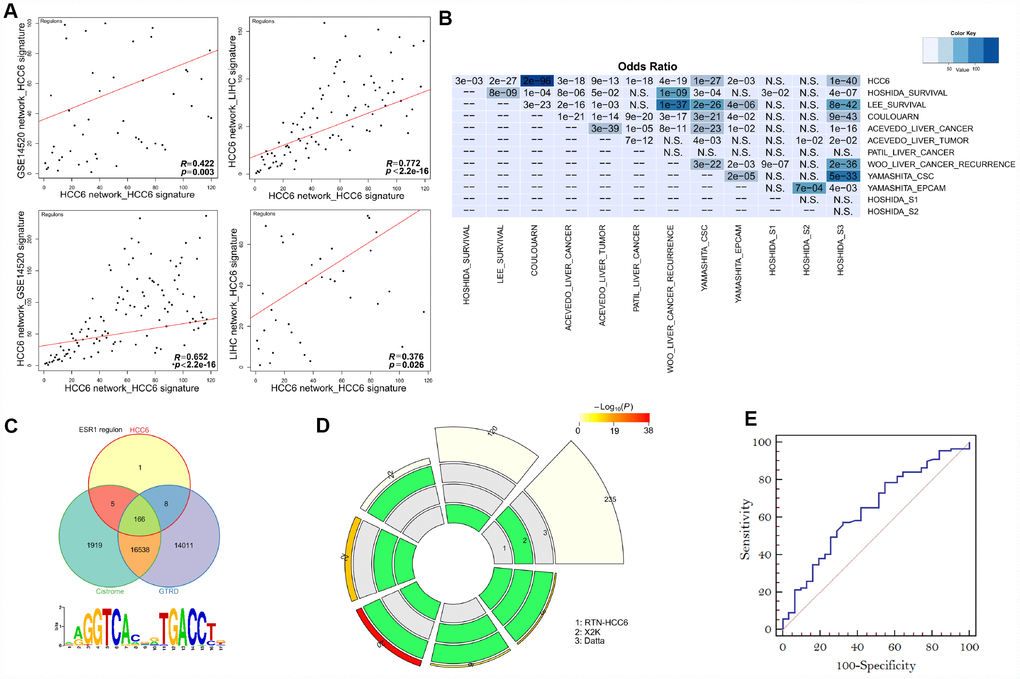
Figure 3.Performance of MR prediction. (A) MRs identified by using LIHC- and GSE14520-derived networks and the HCC6 signatures. The correlation coefficient R is given for each pairwise ranking. (B) Using HCC6 TN and different signatures, enrichment was estimated from the corresponding MRA analyses. The color key represents the odds ratios, and significant P-values are superimposed on the grids. (C) Venn diagrams showing overlap of the ESR1 regulon with corresponding targets from Cistrome and GTRD. The ESR1 motif was enriched in the ESR1 regulon (Pscan analysis). (D) A circular plot visualizing all intersections and the corresponding statistics among three MR discovery methods. The three tracks in the middle represent the three methods, with individual blocks showing “presence” (green) or “absence” (grey) of the gene sets in each intersection. The height of the bars in the outer layer is proportional to the intersection size, as indicated by the numbers on the top of the bars. The color intensity of the bars represents the significance (P value) of the intersections. (E) ROC curves plotted for MR prediction.