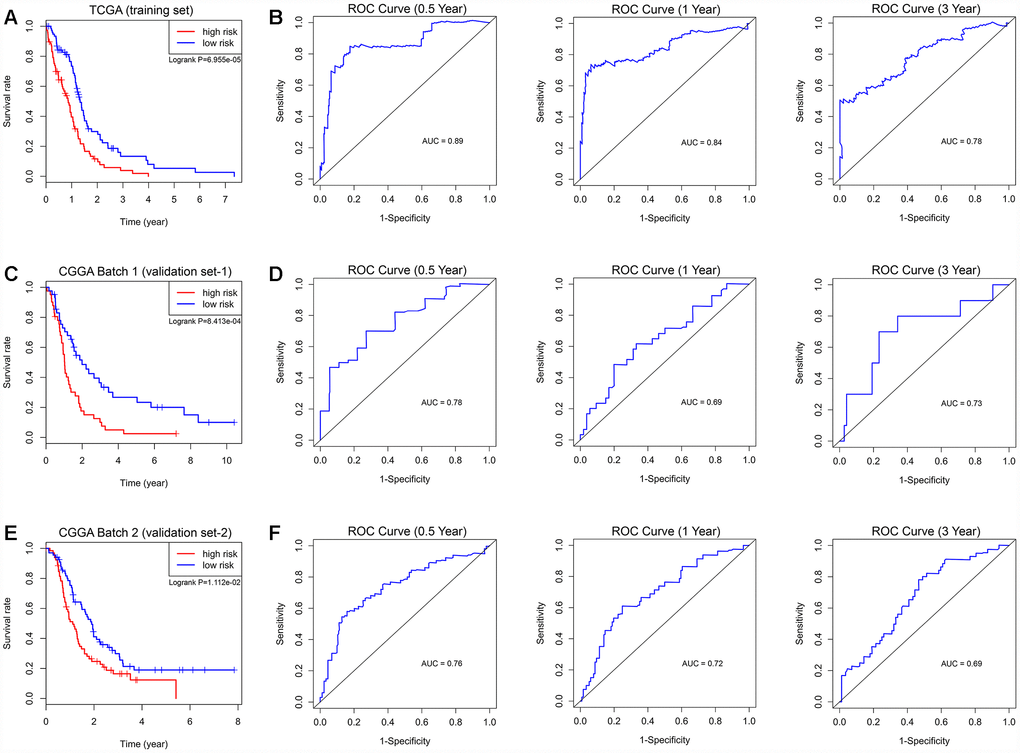
Figure 4.Survival analysis and prognostic performance of the autophagy-related risk score model in GBM. K-M survival curve of the risk score for patient OS in the TCGA training cohort (A), CGGA Batch-1 validation cohort (C), and CGGA Batch-2 validation cohort (E). The high-risk groups had significantly poorer OS rates than the low-risk groups. The prognostic performance of the autophagy signature demonstrated by the time-dependent ROC curve for predicting the 0.5-, 1-, and 3-year OS rates in the TCGA training cohort (B), CGGA Batch-1 validation cohort (D), and CGGA Batch-2 validation cohort (F).