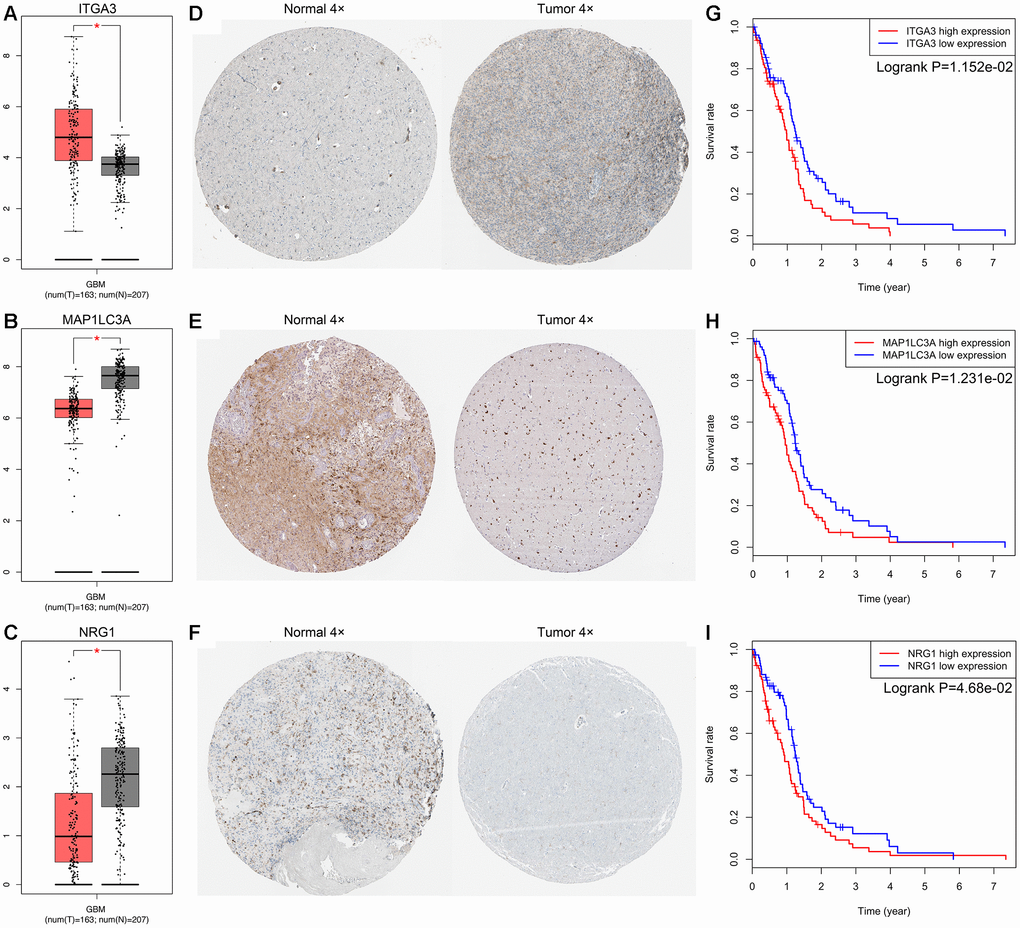
Figure 2.Expression and survival analysis for ITGA3, MAP1LC3A and NRG1 in GBM. The expression levels of ITGA3 (A), MAP1LC3A (B) and NRG1 (C) in tumor and normal tissues were validated in the GEPIA database, which included 163 GBM samples and 207 normal samples. The red box on the left was tumor group, and the gray box on the right was normal group. The expression profiles of the proteins encoded by ITGA3 (D), MAP1LC3A (E) and NRG1 (F) in normal and tumor tissues using clinical specimens from the Human Protein Profiles. K-M OS curves based on the expression levels of ITGA3 (G), MAP1LC3A (H) and NRG1 (I) in patients with GBM in the TCGA dataset.