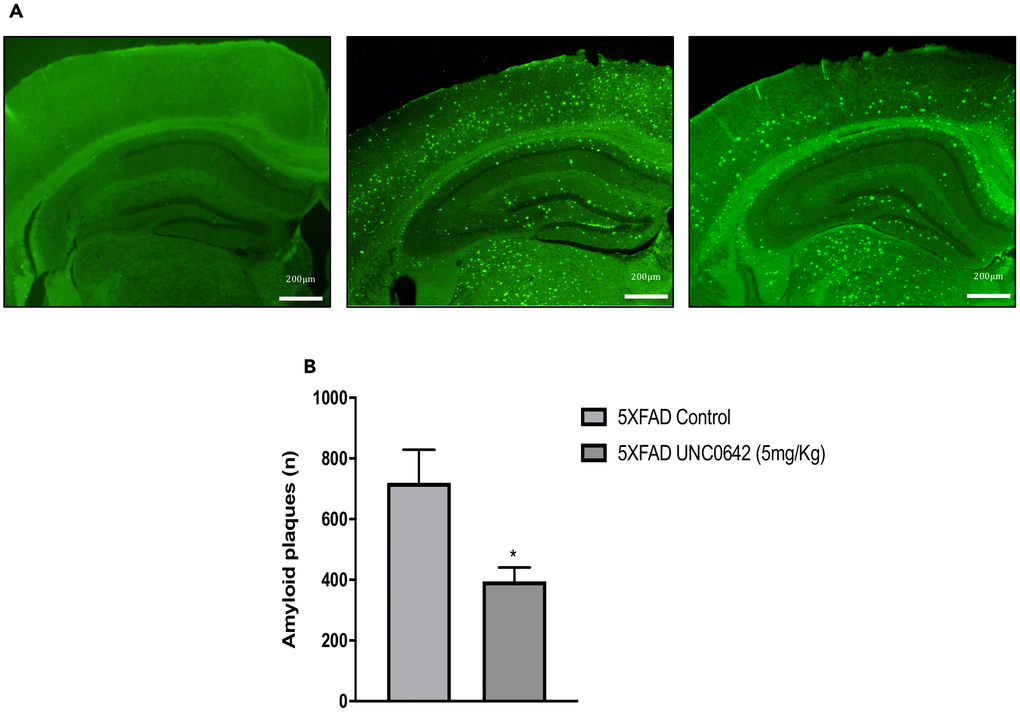
Figure 6.Representative images (A) and quantifications (B) of β-amyloid plaques stained with Thioflavin-S in Wt Control, 5XFAD Control and 5XFAD treated with UNC0642 (5mg/Kg). Values represented are mean ± Standard error of the mean (SEM); (n = 4 for each group). *p<0.05.