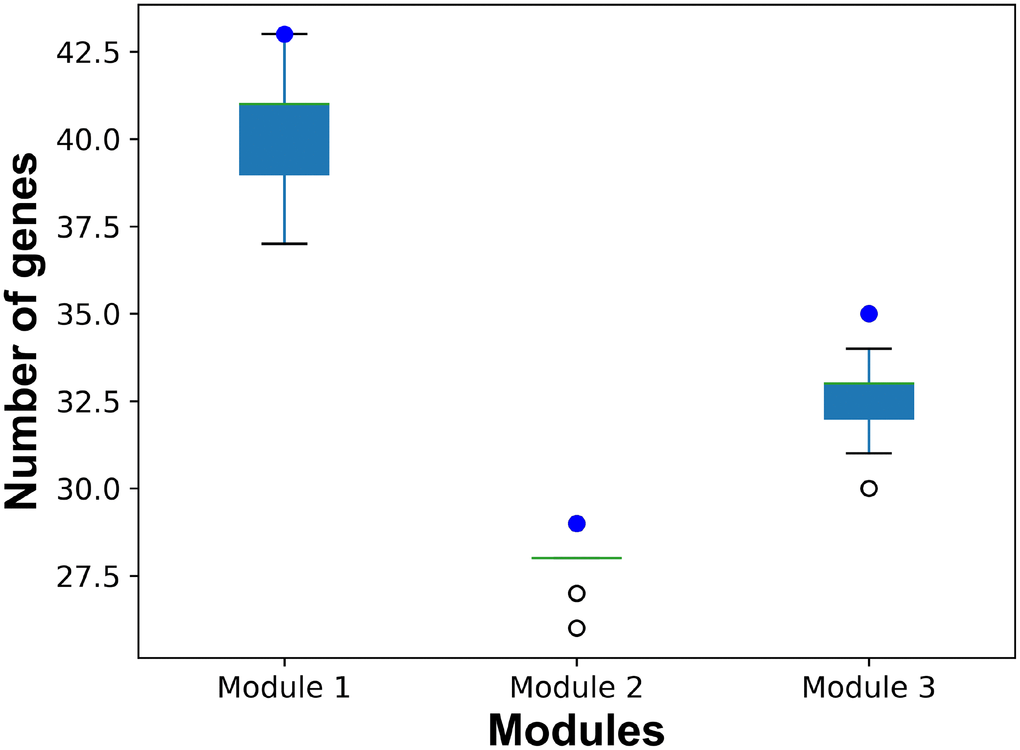
Figure 8.The number of common genes in risk modules from all samples and from random samples. Blue dots represent the number of genes in breast cancer risk modules from all samples. Boxplots represent the distribution of the number of common genes in breast cancer risk modules from all samples and risk modules form random samples.