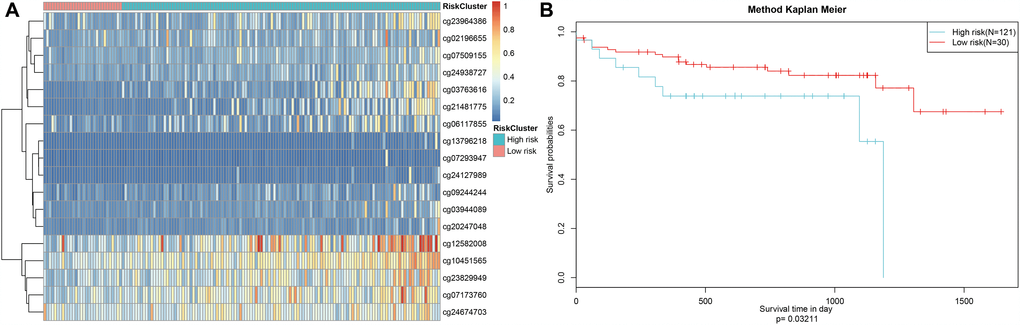
Figure 8.Construction of the prognosis prediction model for training set colon adenocarcinoma patients. (A) ROC curves of prognostic predictors in colon adenocarcinoma patients. (B) The horizontal axis represents the samples, and the vertical axis represents risk scores (top), overall survival (middle), and methylation site (bottom). (C) Analysis of prognostic differences after classification in the training set.