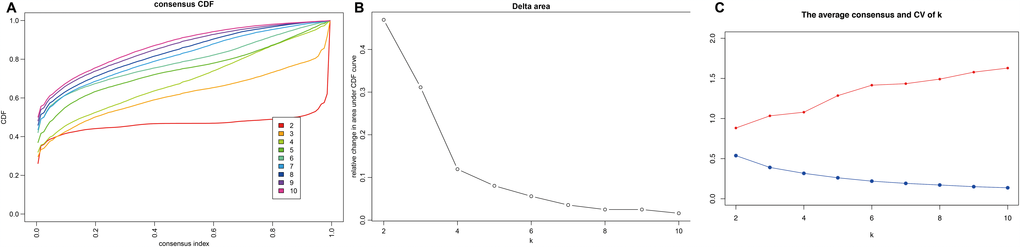
Figure 1.Criteria for selecting number of categories. (A) Consensus among clusters for each category number k. (B) Delta area curves for consensus clustering indicating the relative change in area under the cumulative distribution function (CDF) curve for each category number k compared to k-1. The horizontal axis represents the category number k and the vertical axis represents the relative change in area under CDF curve. (C) The average cluster consensus and coefficient of variation among clusters for each category number k. The blue line represents the average cluster consensus and the red line represents the coefficient of variation among clusters.