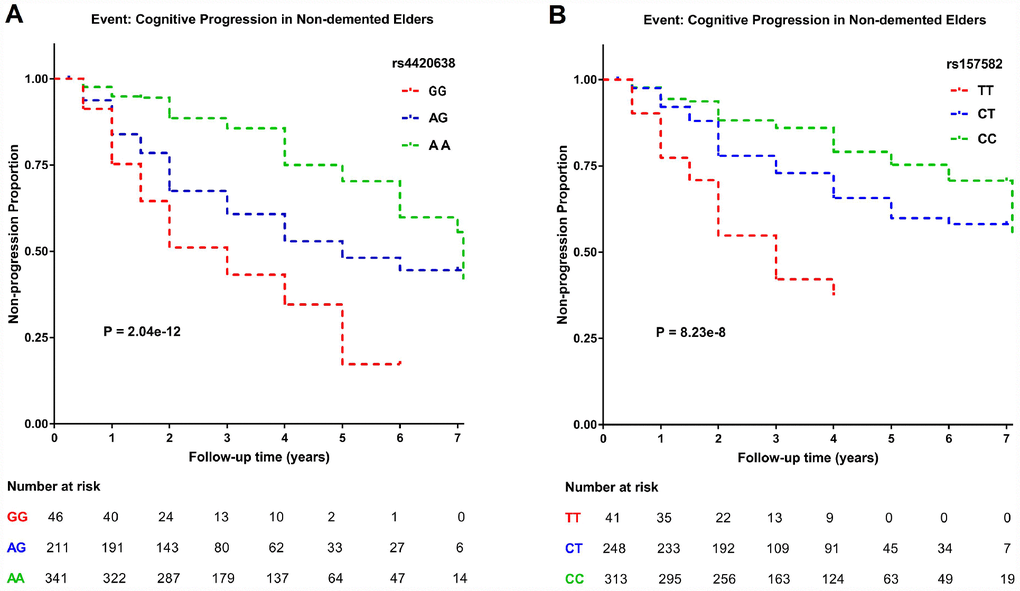
Figure 4.Kaplan–Meier survival curves for probability of cognitive progression. Numbers of individuals at risk at different follow-up time points were presented. Survival time was calculated according to the interval from the initial baseline evaluation to cognitive progression. (A) Subjects with the minor allele of rs4420638 (G) showed a greater rate of cognitive decline. (B) Subjects with the minor allele of rs157582 (T) showed a greater rate of cognitive decline.