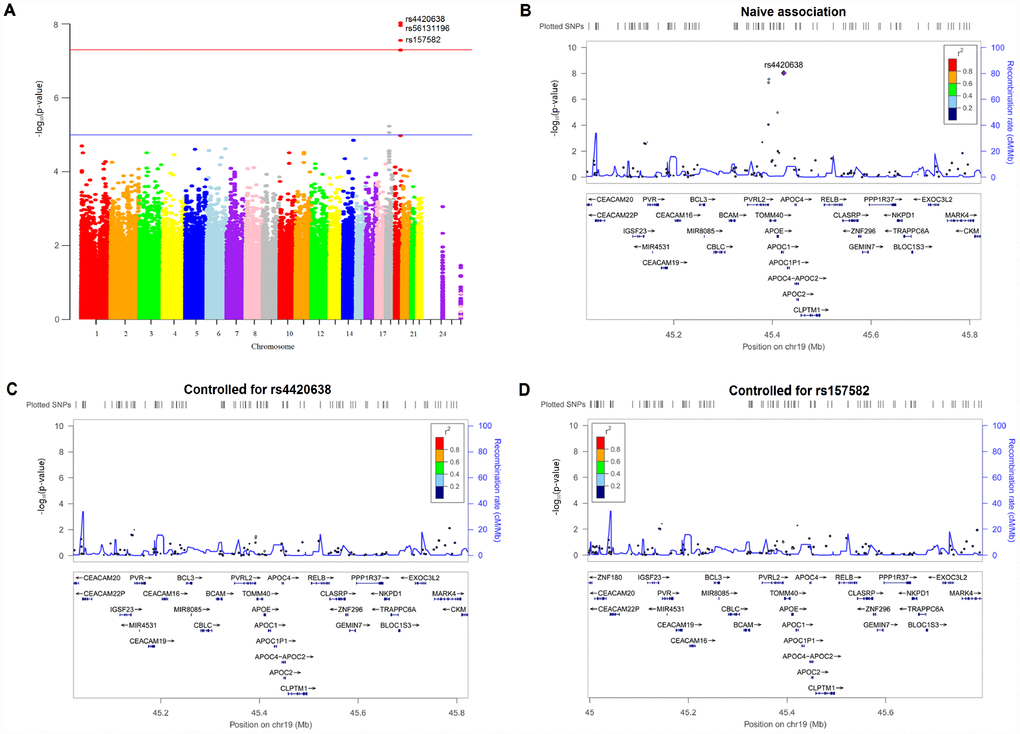
Figure 1.Manhattan and regional plots for associations with hippocampal atrophy rate. (A) Genome-wide signal intensity (Manhattan) plots showing the -log10 (p value) for individual single nucleotide polymorphisms. (B) Regional association results for the 45.0 Mb to 45.8 Mb region of chromosome 19. (C) Association results for the 45.0 Mb to 45.8 Mb region of chromosome 19 controlling for rs4420638. (D) Association results for the 45.0 Mb to 45.8 Mb region of chromosome 19 controlling for rs157582.