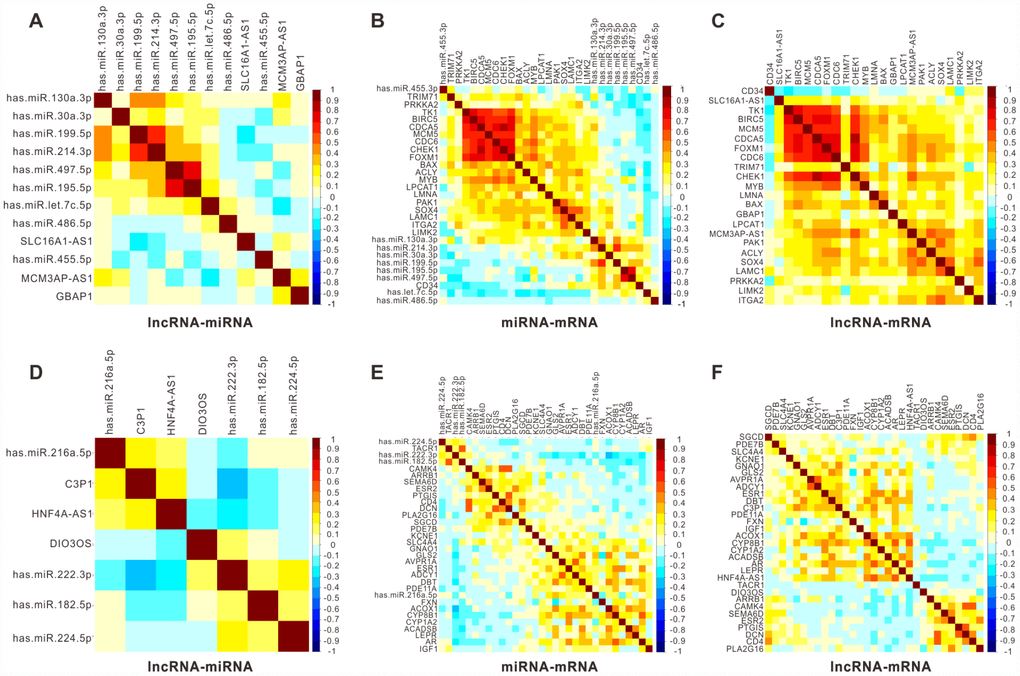
Figure 5.Pearson correlation analysis for six key lncRNAs with their associated miRNA and mRNAs in 366 HCC patients from TCGA. Pearson correlograms of lncRNA-miRNA paris (A), lncRNA-mRNA pairs (B) and mRNA-miRNA pairs (C) in upregulated lncRNAs including GBAP1, MCM3AP-AS1 and SLC16A1-AS1. lncRNA-miRNA paris (D), lncRNA-mRNA paris (E) and mRNA-miRNA paris (F) in downregulated lncRNAs including C3P1, HNF4A-AS1 and DIO3OS by Pearson correlation analysis. The correlation coefficient R value ranges from -1 to 1, the color of which changes from blue to brown.