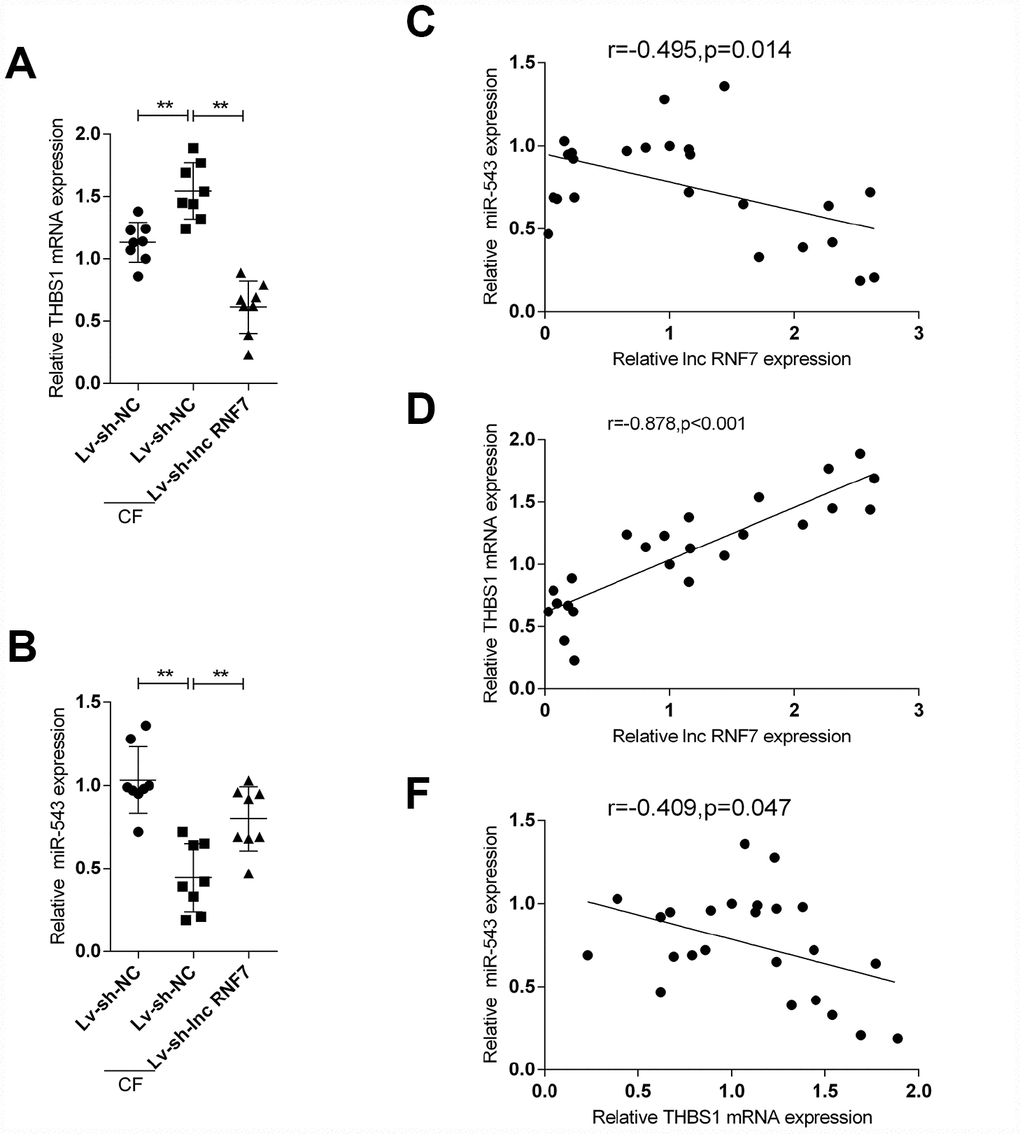
Figure 8.The expression and correlation of miR-543 and THBS1 in rat hearts in control, Lv-sh-NC-, or Lv-sh-lnc RNF7-infection groups. (A, B) Expression of miR-543 and THBS1 in rat hearts in control, Lv-sh-NC-, or Lv-sh-lnc RNF7-infection groups determined by real-time PCR. (C–E) Correlation of lncRNA RNF7, miR-543, and THBS1 in tissue samples analyzed by Pearman’s correlation analyses.