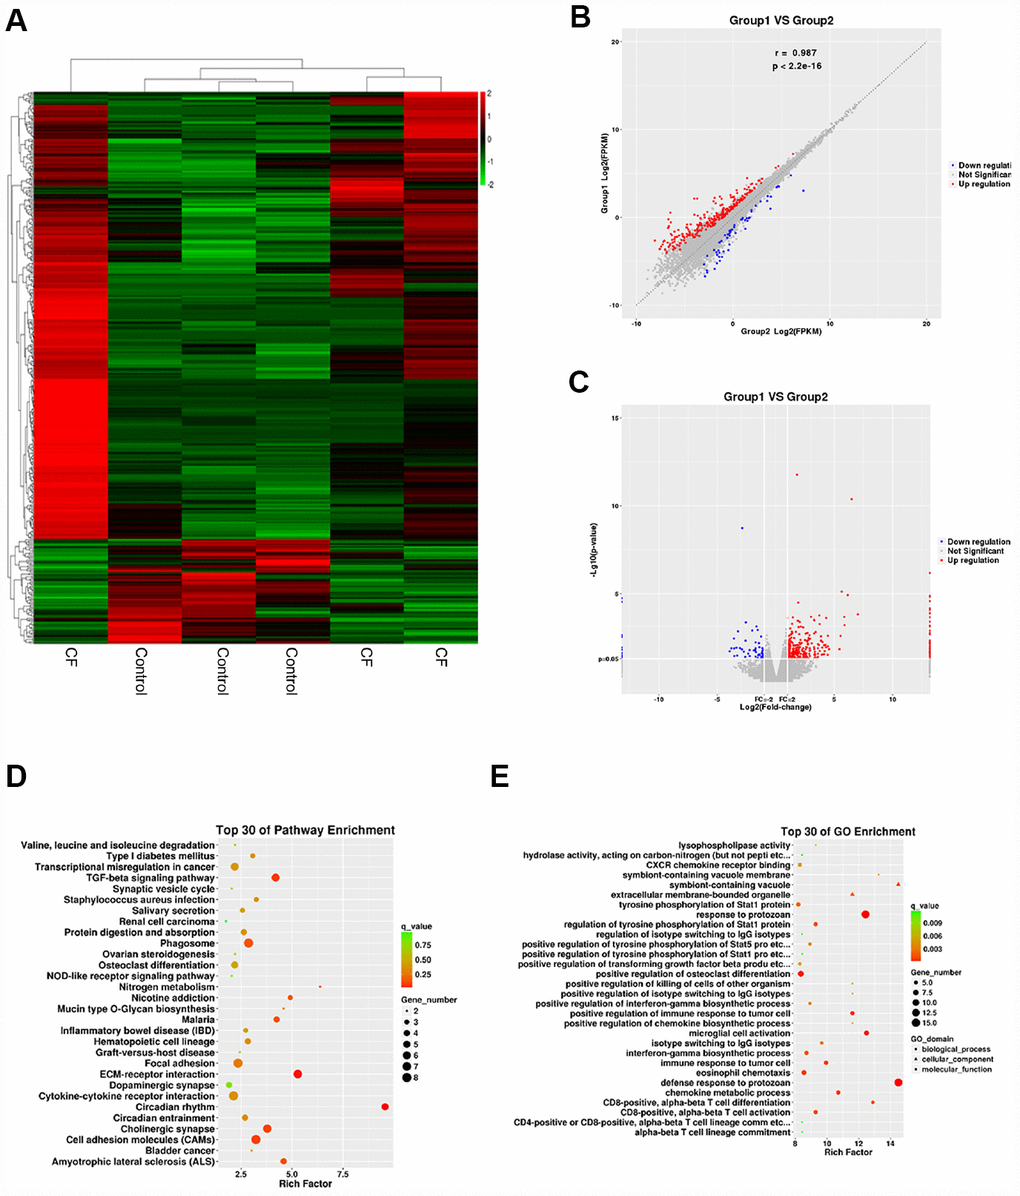
Figure 2.Differentially-expressed mRNAs in CF and normal rat hearts. (A) Hierarchical clustering of differentially-expressed mRNAs in CF and normal rat hearts. (B) Scatter diagram showing the expression correlation of these mRNAs. (C) Volcano plot diagram showing these differentially-expressed mRNAs. (D) KEGG signaling annotation on the differentially-expressed mRNAs. (E) GO Enrichment analyses on the differentially-expressed mRNAs.