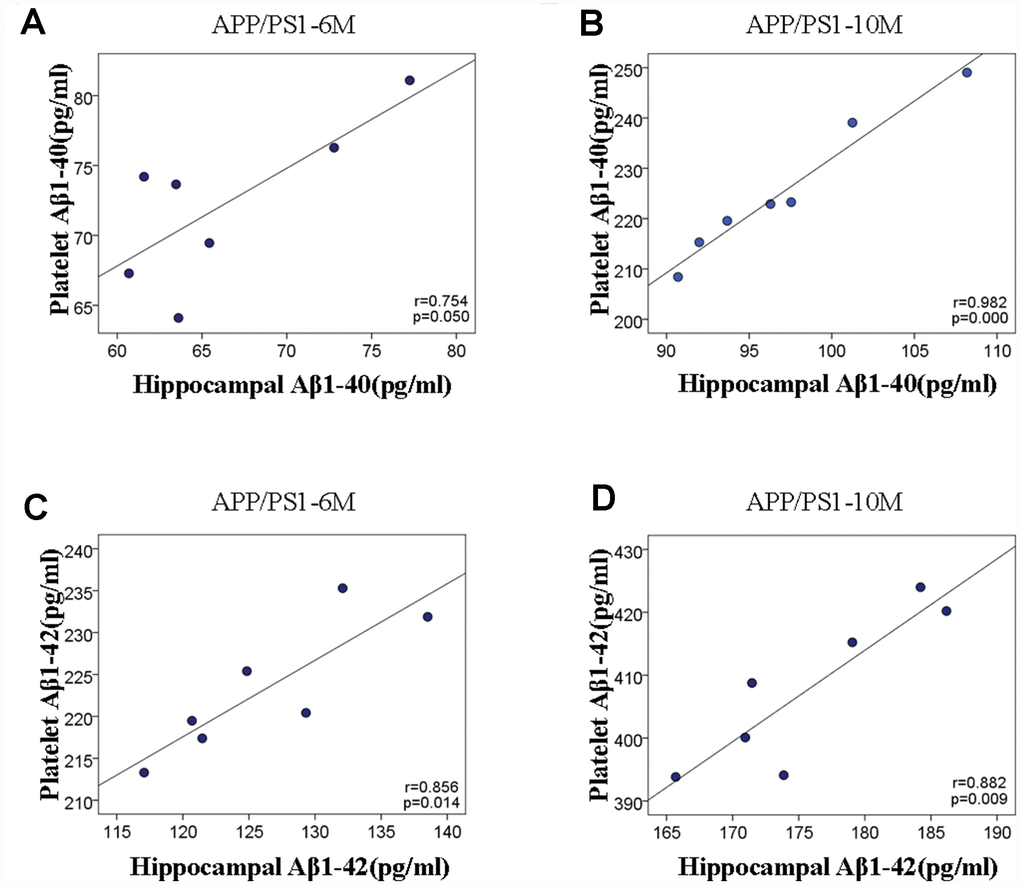
Figure 3.Scatter plots of the correlation between hippocampal and platelet Aβ variables in APP/PS1 transgenic mice and C57 mice. (A) The correlation analysis between hippocampal Aβ1-40 and platelet Aβ1-40 at 6 and 10 months. (B) The correlation analysis between hippocampal Aβ1-42 and platelet Aβ1-42 at 6 and 10months.