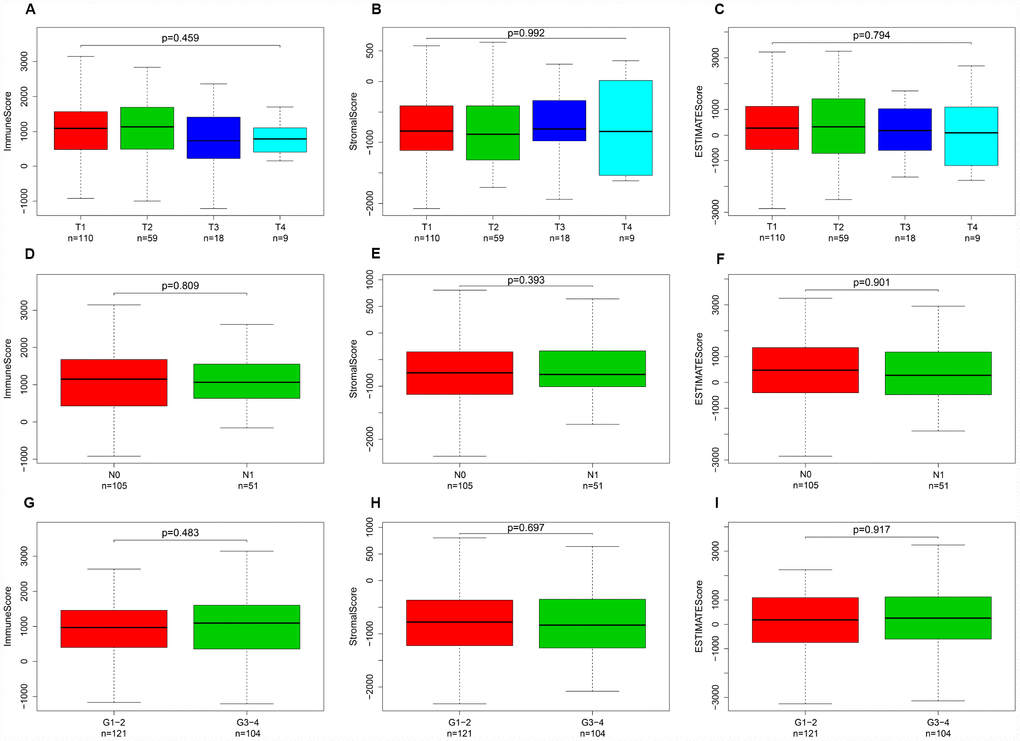
Figure 1.Immune, stromal, and ESTIMATE scores were not correlated with T stage, N stage, or tumor grade. Distribution of immune scores plotted against T stage (A), N stage (D), and tumor grade (G). Distribution of stromal scores plotted against T stage (B), N stage (E), and tumor grade (H). Distribution of ESTIMATE scores plotted against T stage (C), N stage (F), and tumor grade (I).