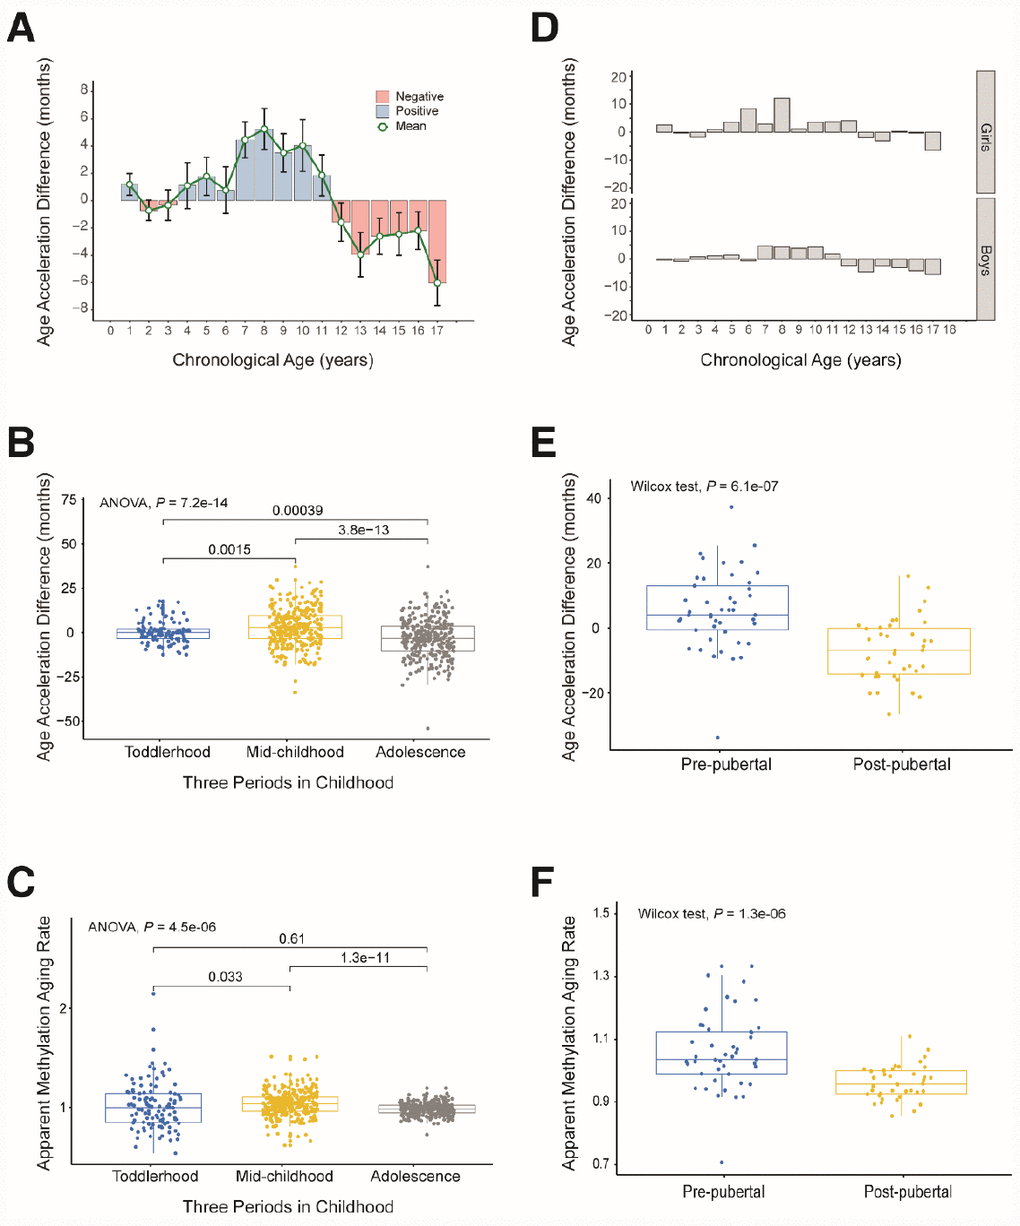
Figure 4.Age acceleration in different periods of childhood. (A) Histogram of the mean value distribution of the age acceleration difference for all individuals. A pink column indicates a negative value, meaning that the average difference between the DNA methylation age and the chronological age is less than zero. A blue column indicates a positive value, meaning that the average difference between the DNA methylation age and the chronological age is greater than zero. The green circle represents the average difference between the DNA methylation age and the chronological age (age unit is years). (B) Boxplot of the age acceleration difference during different periods of childhood. The blue box indicates toddlerhood, the yellow box indicates mid-childhood and the gray box indicates adolescence. (C) Boxplot of the apparent methylation aging rate during different periods of childhood. The box colors have the same meaning as above. (D) Histograms of the mean value distribution of the age acceleration difference for girls and boys, respectively. (E) Boxplot comparing the age acceleration difference between pre-pubertal and post-pubertal individuals. The blue box indicates pre-pubertal individuals and the yellow box indicates post-pubertal individuals. (F) Boxplot comparing the apparent methylation aging rate between pre-pubertal and post-pubertal individuals. The box colors are the same as above.