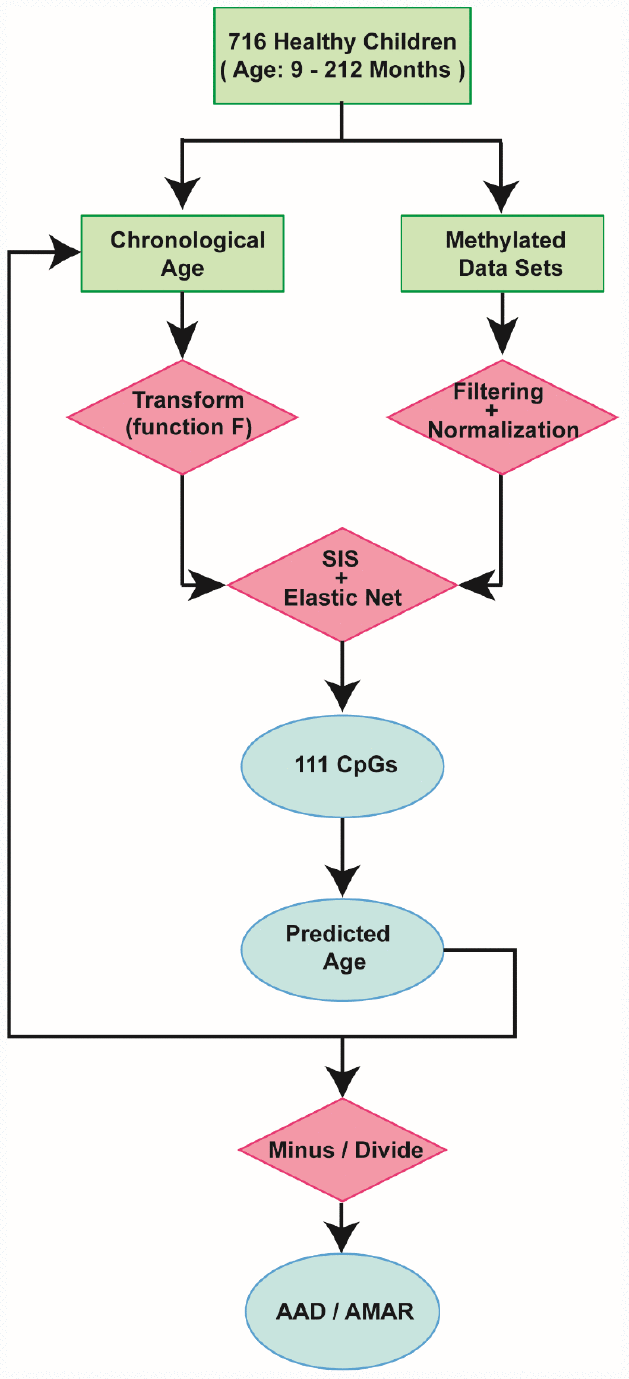
Figure 2.Schematic of the prediction model. A flow diagram of the child-specific methylation-based age prediction model. The green boxes represent the input data, the red diamonds represent the analysis methods and the blue ovals represent the prediction results. AAD: age acceleration difference; AMAR: apparent methylation aging rate; SIS: sure independence screening.