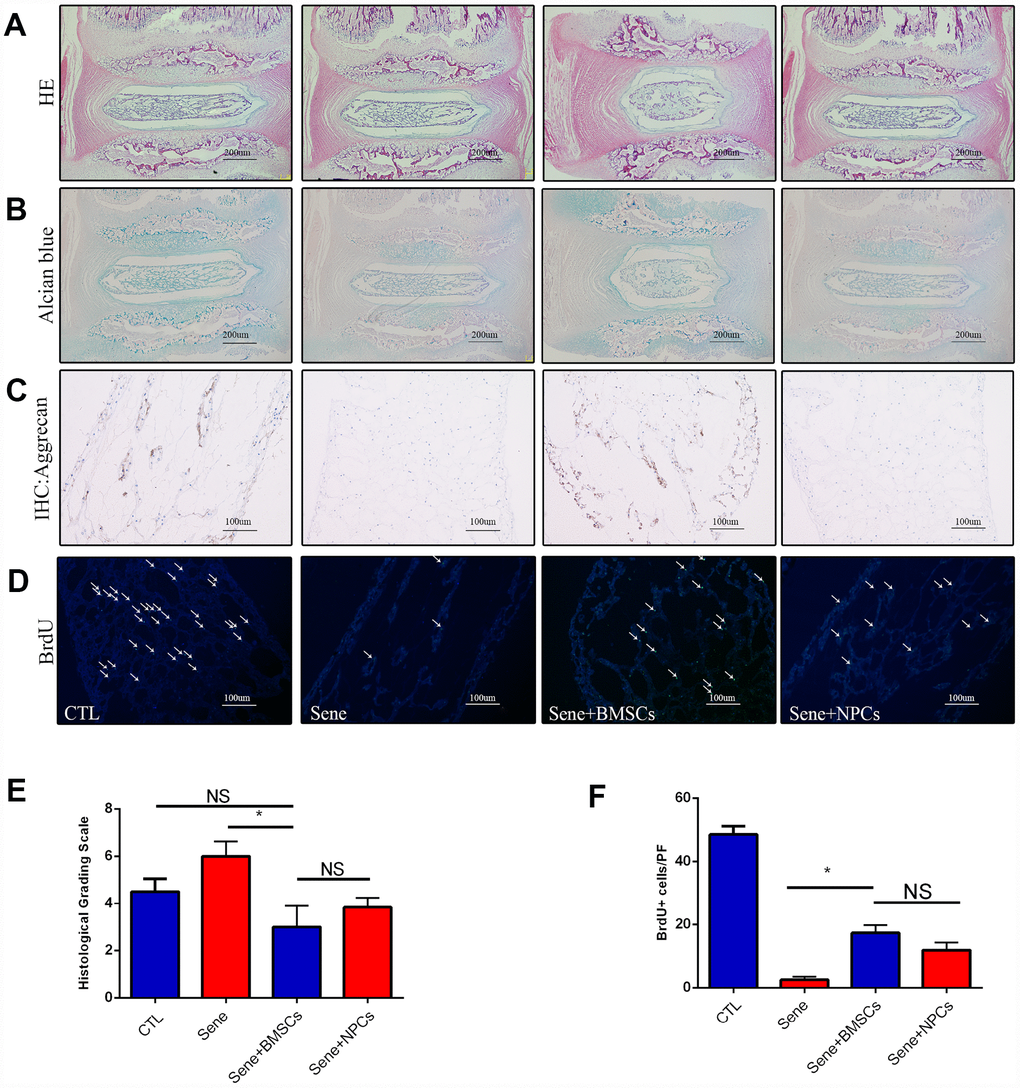
Figure 6.Staining with HE, Alcian blue, immunohistochemistry of aggrecan and BrdU between CTL, Sene, Sene+BMSCs and Sene+NPCs groups. n=5, Scale bar, as indicated. Values represent means±S.D. Significant difference between different groups is indicated as *P < 0.05.PF: per field.