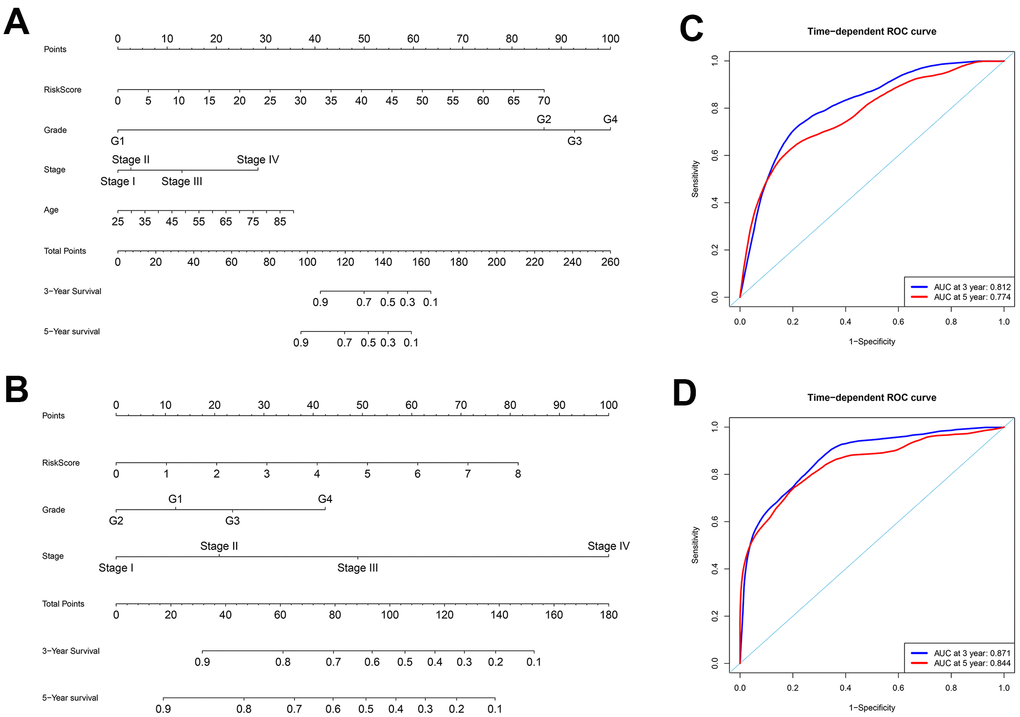
Figure 7.Construction of nomograms and ROC curve analysis of prognosis for ccRCC patients from the TCGA database. (A–B) The nomograms for (A) OS and (B) DFS are shown. (C–D) ROC curve analysis shows 3-year (blue) and 5-year (red) OS and the corresponding AUC values for the ccRCC patients from the TCGA database. (D) ROC curve analysis shows 3-year (blue) and 5-year (red) DFS and the corresponding AUC values for the ccRCC patients from the TCGA database.