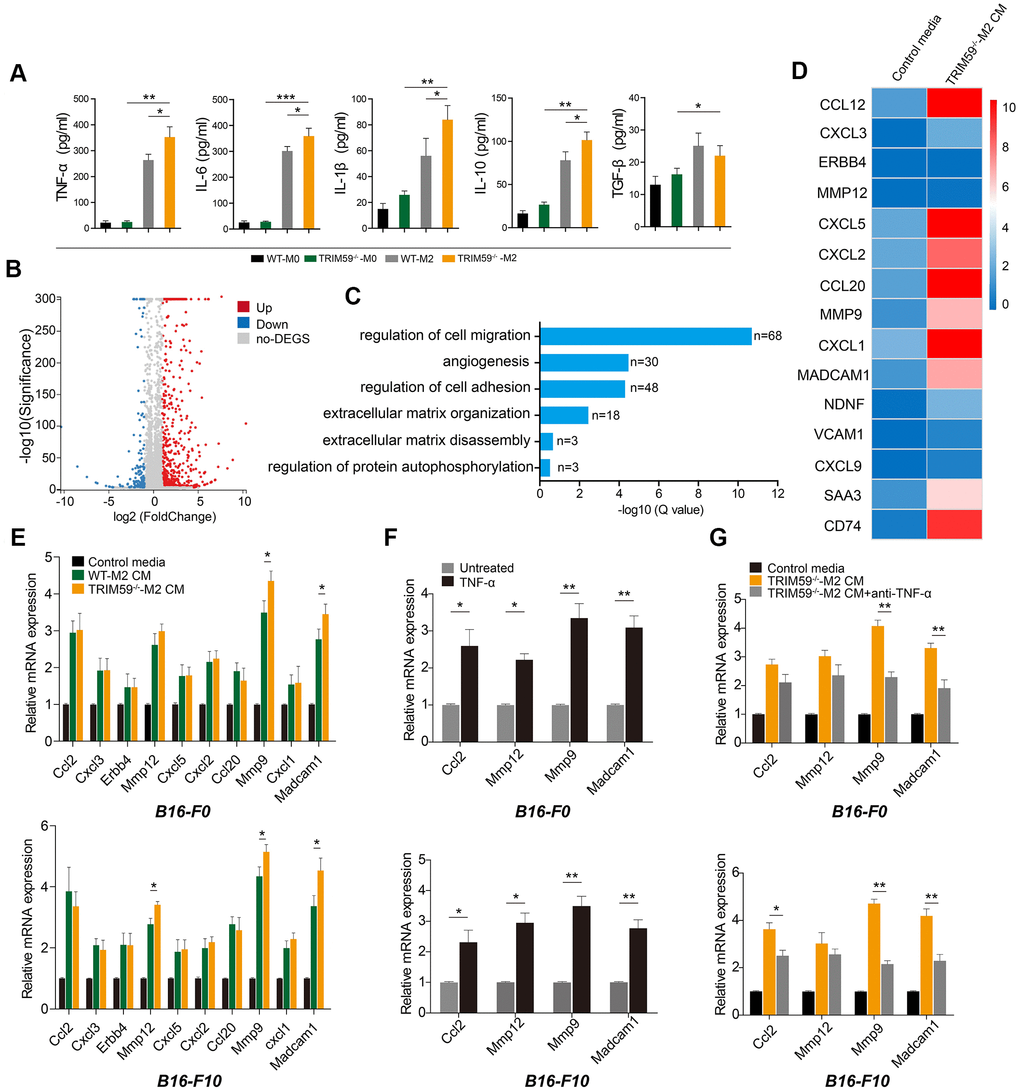
Figure 3.CM from TRIM59-/--M2 contains TNF-α and induces expression of ccl2, MMP-12, MMP-9, and Madcam1 in melanoma cells. (A) ELISA detection of cytokines in culture supernatants from WT-M0, TRIM59-/--M0, WT-M2, and TRIM59-/--M2 macrophages. Data are represented as mean ± SD. *p<0.05, **p<0.01, ***p<0.001, compared with the TRIM59-/--M2 group. (B) Scatter plots showing DEGs detected in B16-F10 cells treated with TRIM59-/--M2 CM. (C) GO enrichment analysis of DEGs identified in B16-F10 cells exposed to TRIM59-/--M2 CM. (D) Top 15 DEGs. (E) qRT-PCR detection of the top 10 DEGs in cells treated with control media, WT-M2 CM, orTRIM59-/--M2 CM. Data are represented as mean ± SD. *p<0.05, compared with the WT-M2 CM group. (F) qRT-PCR detection of ccl2, MMP-12, MMP-9, and Madcam1 expression in B16-F0 and B16-F10 cells treated with or without TNF-α. Data are represented as mean ± SD. *p<0.05, **p<0.01, compared with untreated cells. (G) qRT-PCR detection of ccl2, MMP-12, MMP-9, and Madcam1 expression in B16-F0 and B16-F10 cells treated with control media, TRIM59-/--M2 CM, or TRIM59-/--M2 CM containing a neutralizing TNF-α antibody. Data are represented as mean ± SD. *p<0.05, **p<0.01, compared with untreated cells.