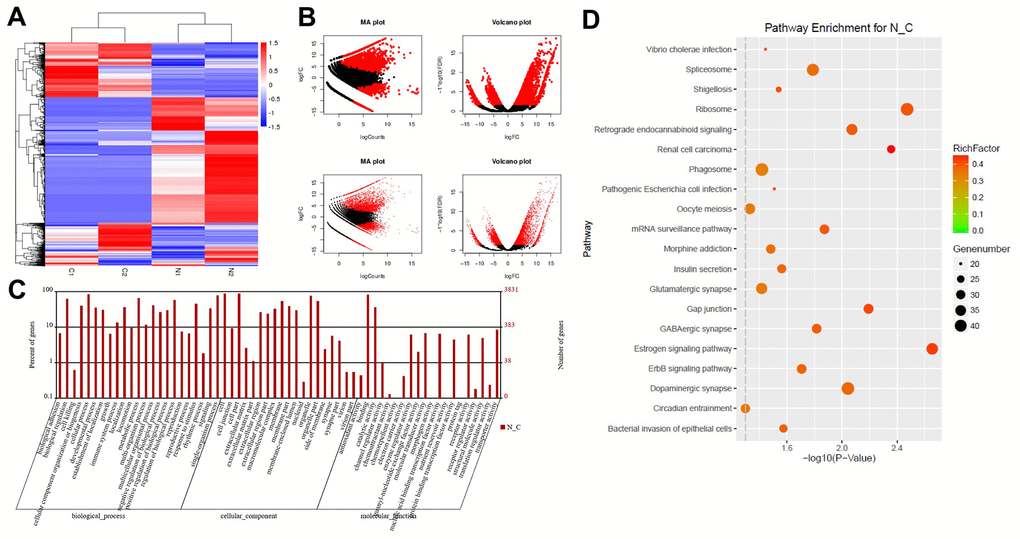
Figure 1.DEG screening in glioblastoma and normal tissues. (A) Heat map showing a distinguishable expression profile of genes between tumor tissues and adjacent tissues. Black represents no change in gene expression, while red represents upregulation and green represents downregulation. (B) The DEGs of statistical significance are represented as red points on the MA plot (log total counts versus log2 fold-change) and the volcano plot (log2 fold-change versus log false discovery rate). (C) DEGs were evaluated by gene ontology (GO) analysis. (D) DEGs were evaluated by Kyoto Encyclopedia of Genes and Genomes (KEGG) analysis.