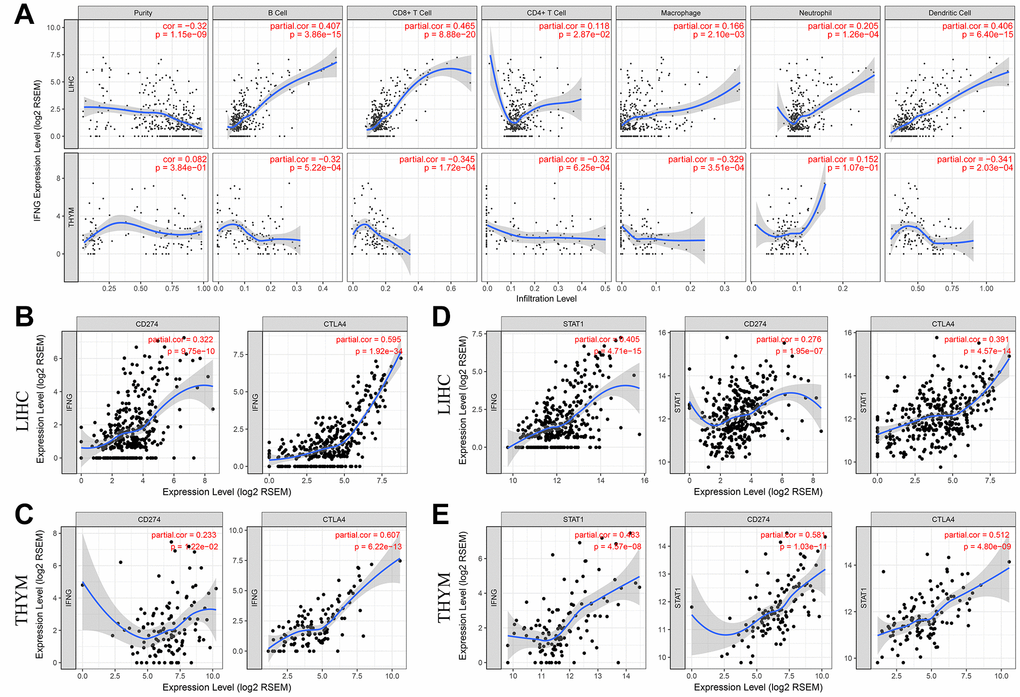
Figure 4.PD-L1 and CTLA-4 are potential downstreams of RP11-424C20.2/UHRF1 axis. (A) Correlation of IFN-γ expression with immune infiltration in LIHC and THYM. (B) and (C) Correlation analysis between IFN-γ expression and PD-L1 or CTLA-4 in LIHC and THYM. (D) and (E) Correlation analysis between STAT1 and IFN-γ, PD-L1 or CTLA-4 in LIHC and THYM.