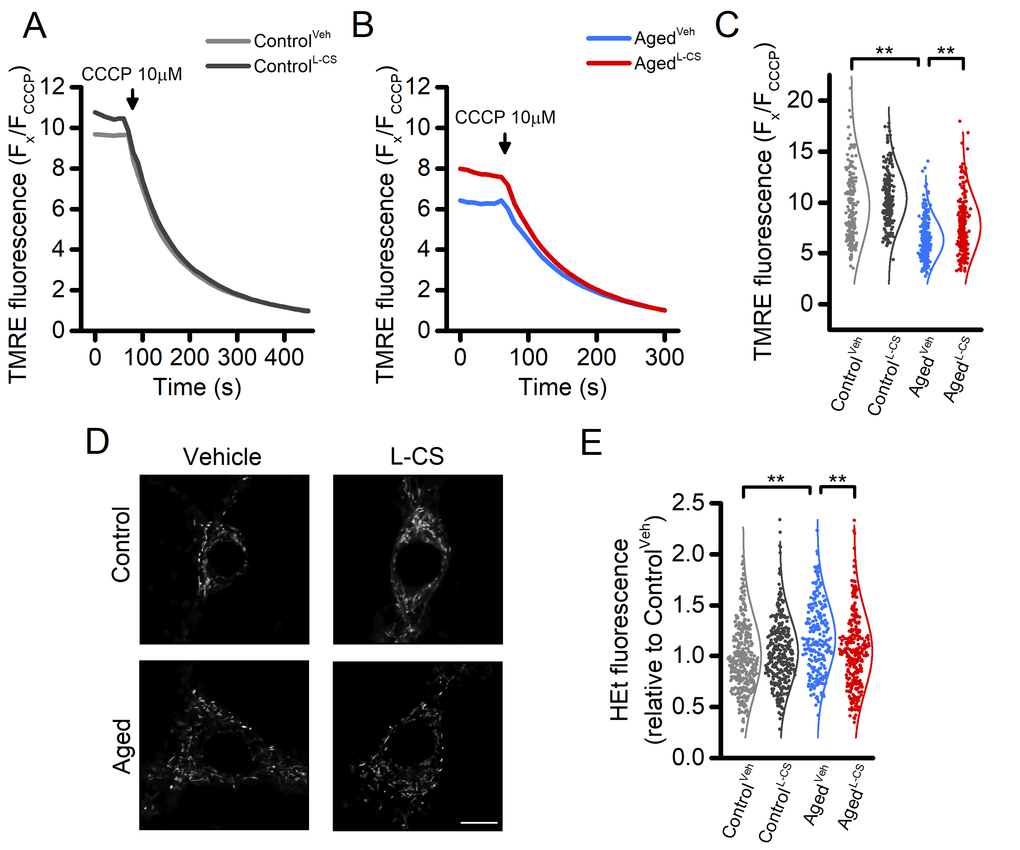
Figure 3.Effects of aging and L-CS on mitochondrial functioning, morphology, and ROS generation in cortical neurons.(A-B) Time course of CCCP-driven dissipation of the mitochondrial Δp. Traces represent the average response to 10 µM CCCP exposure. (ControlVeh: n=189 cells and ControlL-CSn=228; AgedVehn=255 cells and AgedL-CSn=240 cells obtained from 4-5 independent experiments). Please, note that aged cortical cultures require a shorter CCCP exposure time (4 min) to reach resting fluorescence levels (B). (C) Dot plots depict quantification of data shown in A and B. Note that the maneuver, along with the normalization procedure (expressed as Fx/FCCCP), represents an estimation of the resting mitochondrial Δp. (D) Representative super-resolution confocal images of Mitotracker Green-loaded control and aged neuronal cultures treated either with L-CS or vehicle (for quantification see Supplementary Table 1, n=4-6 neurons per condition; scale bar 10 µm). Please, note that no major morphological changes were observed among study groups. (E) Dot plots depict normalized resting HEt fluorescence obtained from the four study groups (ControlVeh: n=361 cells and ControlL-CSn=332; AgedVehn=233 cells and AgedL-CSn=301 cells obtained from 5-9 independent experiments). Means were compared by two-way ANOVA followed by Tukey post-hoc test. ** indicates p<0.01.
Figure 3 — Inhibition of de novo ceramide biosynthesis affects aging phenotype in an in vitro model of neuronal senescence | Aging