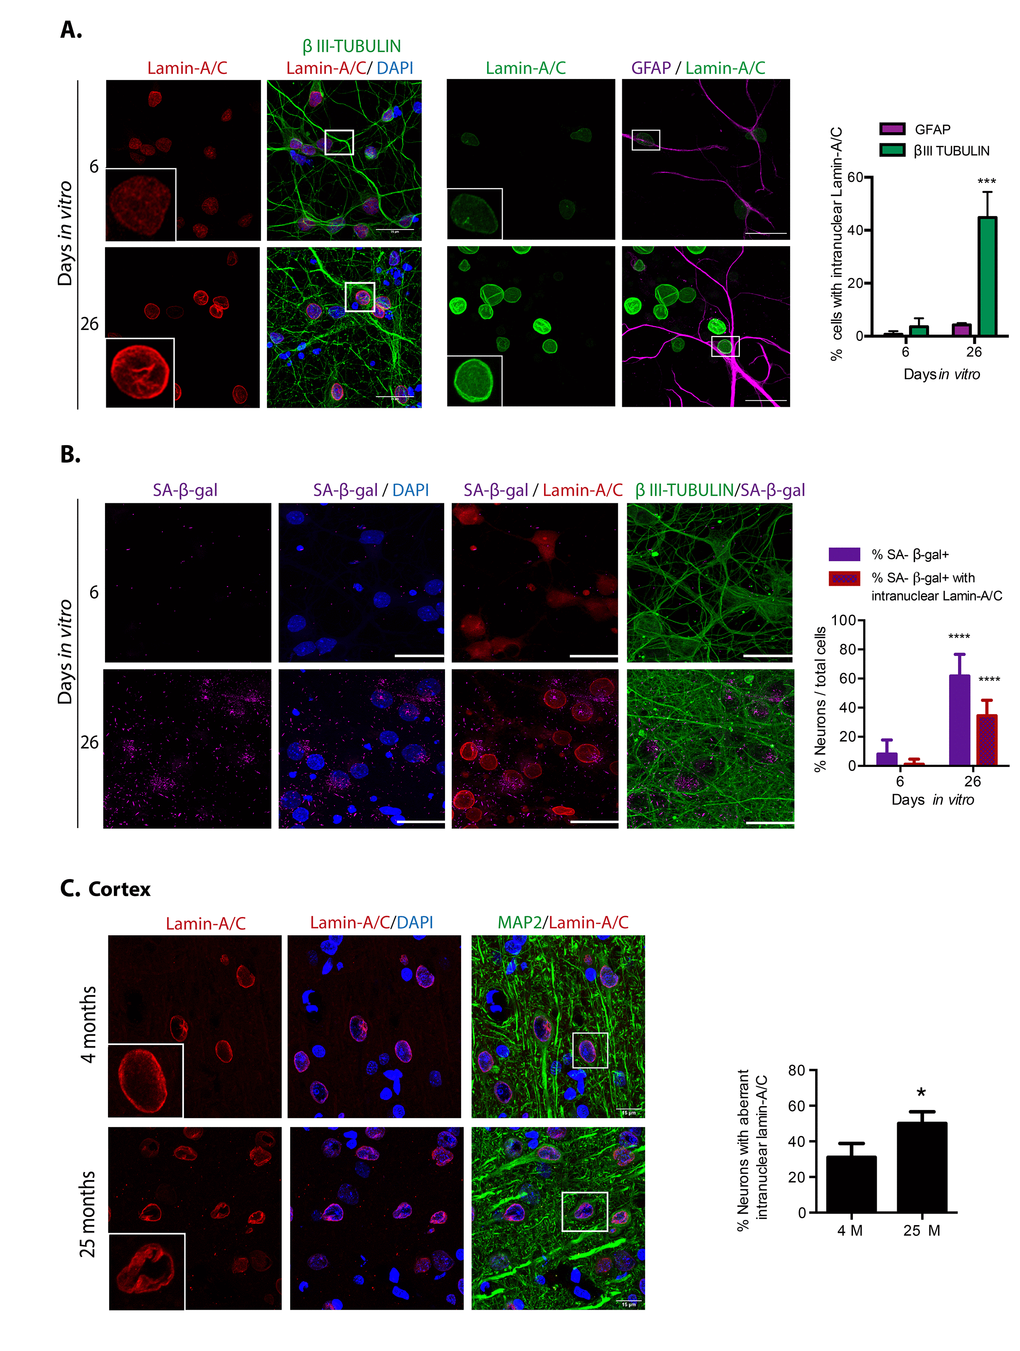
Figure 4.Cortical cells in long-term culture and in old rat brains had nuclear morphology abnormalities. (A) Immunofluorescence to detect Lamin-A/C in neurons (expressing βIII-TUBULIN) or astrocytes (expressing GFAP), in primary culture of cortical cells incubated during the indicated days in vitro. Squares indicate the magnified area shown in insets. Representative images of three independent experiments are shown. Scale bars represent 25 μm. Right, percentage of neurons or astrocytes with aberrant nuclear morphology over total cells. Bars represent SEM; two-way RM ANOVA analysis, *** p< 0.001 in comparison with 6 DIV. (B) Simultaneous detection of SA-β-gal activity (by confocal microscopy) and Lamina-A/C (by immunofluorescence) in neurons (expressing βIII-TUBULIN) in primary culture of cortical cells incubated during the indicated days in vitro. Representative images of three independent experiments are shown. Scale bars represent 25 μm. Right, percentage of neurons with visible SA-β-gal activity, and with both visible SA-β-gal activity and aberrant intranuclear Lamin-A/C over total cells. Five fields from three independent experiments were quantified. Bars represent SEM. Two-way RM ANOVA analysis, followed by Sidak´s multiple comparison test. **** p< 0.0001 in comparison with 6 DIV. C. Immunofluorescence to detect Lamin-A/C in cortical neurons in the internal pyramidal layer 5 from brain slices of the indicated age. Notice that also in vivo, neurons in old brains had nuclear deformations. Squares indicate the magnified area shown in insets. Scale bars represent 30 μm. Right, percentage of neurons in with aberrant nuclear morphology in cortical brain slices of the indicated age, as shown in (C). (n=3). Bars represent SD; unpaired t Test Student * p< 0.01.