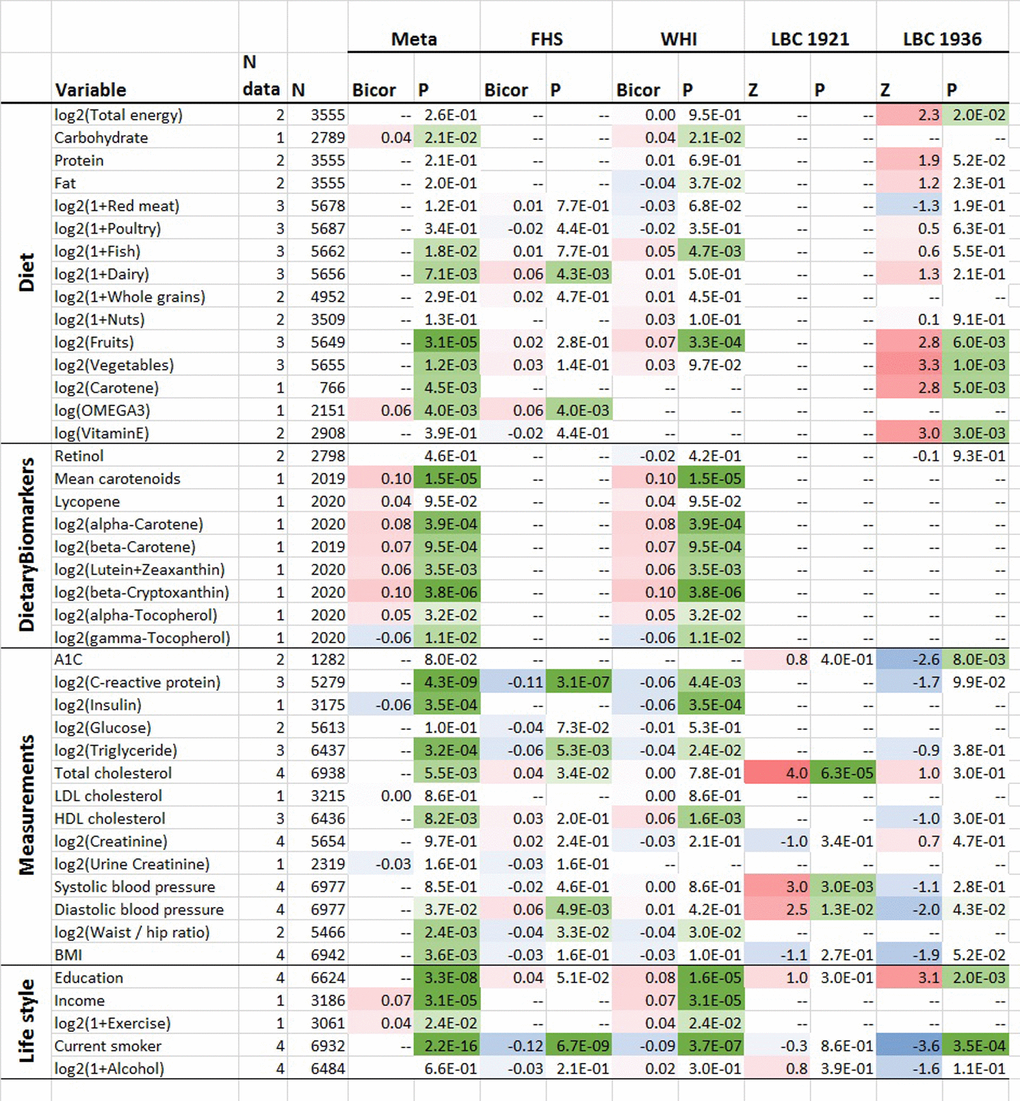
Figure 5.Cross sectional associations between age-adjusted DNAmTL versus lifestyle/dietary variables. Association analysis between age-adjusted DNAmTL (DNAmTLadjAge) and 43 variables including 15 self-reported diet, 9 dietary biomarkers, 14 variables related to metabolic traits and central adiposity, and 5 life style factors, based on the meta-analysis across the FHS WHI, LBC 1921 and LBC 1936 cohort. Robust correlation coefficients (biweight midcorrelation) analysis were performed on the FHS and WHI cohort while generalized linear regression analysis adjusted for sex was performed on the LBC 1921 and 1936 cohort, respectively. For each variable, we display number of datasets, number of total subjects, the robust correlation results from the meta-analysis, FHS, and the WHI cohort and the Z statistics for the LBC respectively. The meta-analysis was based on Stouffer’s method for the majority of the variables or fixed effect models. The 2-color scale (blue to red) color-codes bicor correlation coefficients in the range [-1, 1] or Z statistics. The green color scale (light to dark) applied to unadjusted P values. Cell entry "--" denotes not available. The correlation analysis results stratified by sex using the FHS cohort are listed in Supplementary Figure 11 and stratified by ethnic group using the WHI cohort are listed in Supplementary Figure 12, respectively.