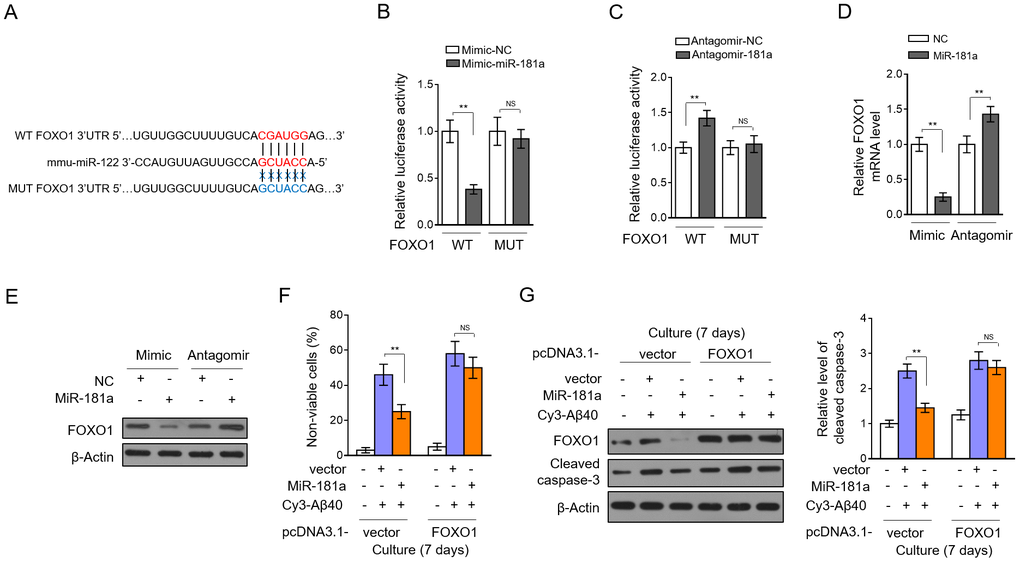
Figure 6.miR-181a protects pericytes by directly targeting FOXO1. (A) Specific binding sequence of miR-181a in the 3’-UTR of mouse FOXO1 mRNA (upper). The mutant sequence of 3’-UTR of mouse FOXO1 mRNA is also shown (below). (B) HEK293 cells were cotransfected negative control (NC) mimic or miR-181a mimic with dual-luciferase reporter plasmid expressing 3’-UTR of wild-type FOXO1 (WT) or mutant FOXO1 (MUT). Two days later, the luciferase activity was measured. Results are expressed as relative to NC. Data are mean ± SD (n = 3). (C) HEK293 cells were cotransfected negative control (NC) antagomir or miR-181a antagomir with dual-luciferase reporter plasmid expressing 3’-UTR of WT FOXO1 or MUT FOXO1. Two days later, the luciferase activity was measured. Results are expressed as relative to NC. Data are mean ± SD (n = 3). (D) Murine brain pericytes were transfected with NC mimic or miR-181a mimic, or NC antagomir or miR-181a antagomir. Three days later, the expression of FOXO1 was determined by qRT-PCR analysis. U6 was used as an internal control. Results are expressed as relative to NC. Data are mean ± SD (n = 3). (E) Pericytes were treated as in (D). The expression of FOXO1 was determined by Western blotting analysis. β-actin was used as a loading control. The representative blot images are shown (n = 3). (F–G) Murine brain pericytes were transfected with pcDNA3.1-vector or pcDNA3.1-FOXO1. Two days later, pericytes were cultured with or without 5 mM Aβ40 for consecutive 7 days. (F) Cell death was evaluated by Trypan blue staining. Results are expressed as percentage of Trypan blue positive cells (non-viable) among total cell number (%). Data are mean ± SD (n = 5). (G) The expression of FOXO1 and cleaved caspase-3 was determined by Western blotting analysis. β-actin was used as a loading control. The representative blot images (left) and quantification analysis of cleaved caspase-3 expression (right) are shown. Data are mean ± SD (n = 3). Dara were compared by one-way ANOVA followed by Tukey’s post-hoc tests. **, P < 0.01; NS, not significant.