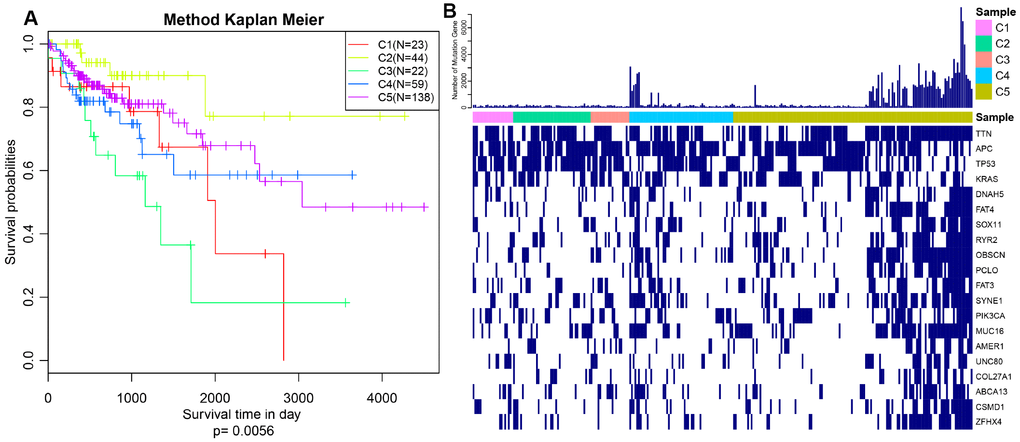
Figure 1.Prognosis description and profiling of mutation genes across five subtypes. (A) Kaplan–Meier plot analysis for five subtypes identified by iCluster (C1, C2, C3, C4, C5) is shown for overall survival (OS). (P=0.0056) (B) Exhibition of top 20 mutated genes among five molecular subtypes.