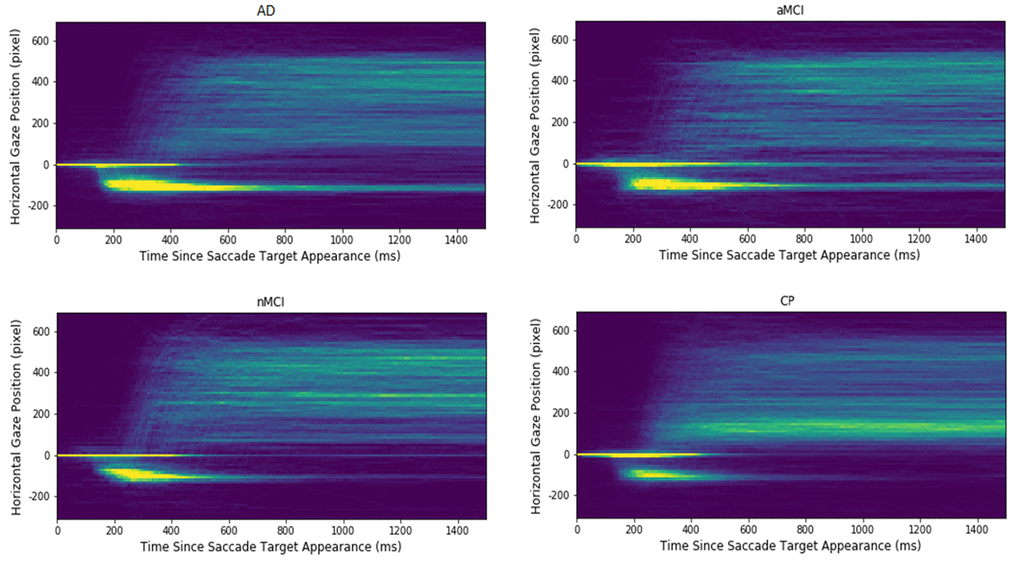
Figure 2.Heatmap plots of the extracted gaze signals in each of participant groups. The x-axis indicates the time since saccadic target appearance, and the y-axis presents the aligned horizontal gaze position. The warmer the colour; the higher is the gaze point density in the corresponding spatial-temporal location. Note that the longest "comet" tails, reflecting a high proportion of uncorrected errors, are evident for the Alzheimer's (AD) and the amnesic Mild Cognitive Impairment (aMCI) groups. The control participants (CP) and the non- amnesic MCI have distinctly shorter "comet" tails.