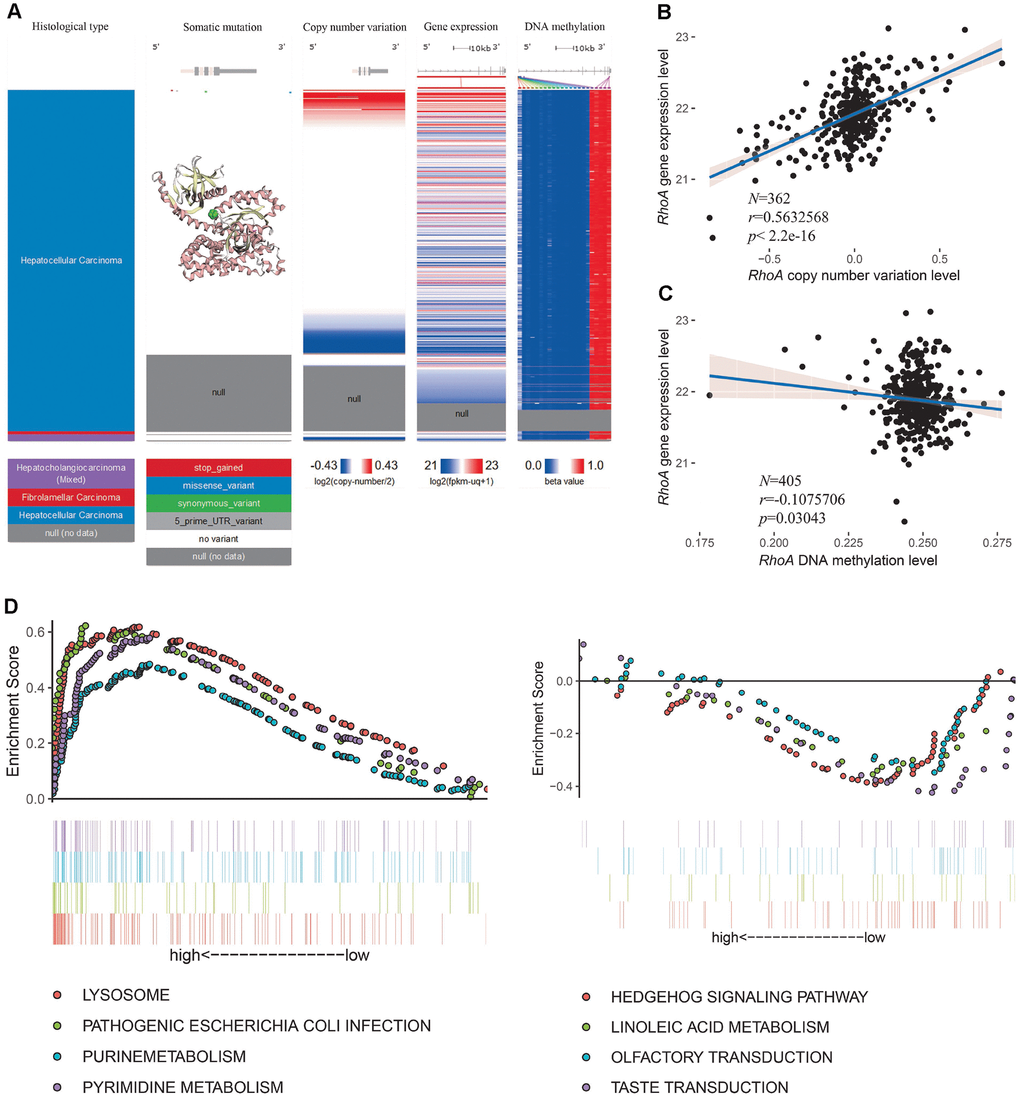
Figure 5.RhoA dysregulation and related KEGG analysis. Multiomic data of RhoA in liver cancer tissues are displayed in a heatmap (A). The correlation between RhoA gene expression level and copy number variation level (B) or DNA methylation level (C) were determined by regression analysis. The top 4 Kyoto Encyclopedia of Genes and Genomes pasthways identified via gene set enrichment analysis of tissues with high and low Rho expression levels (D).