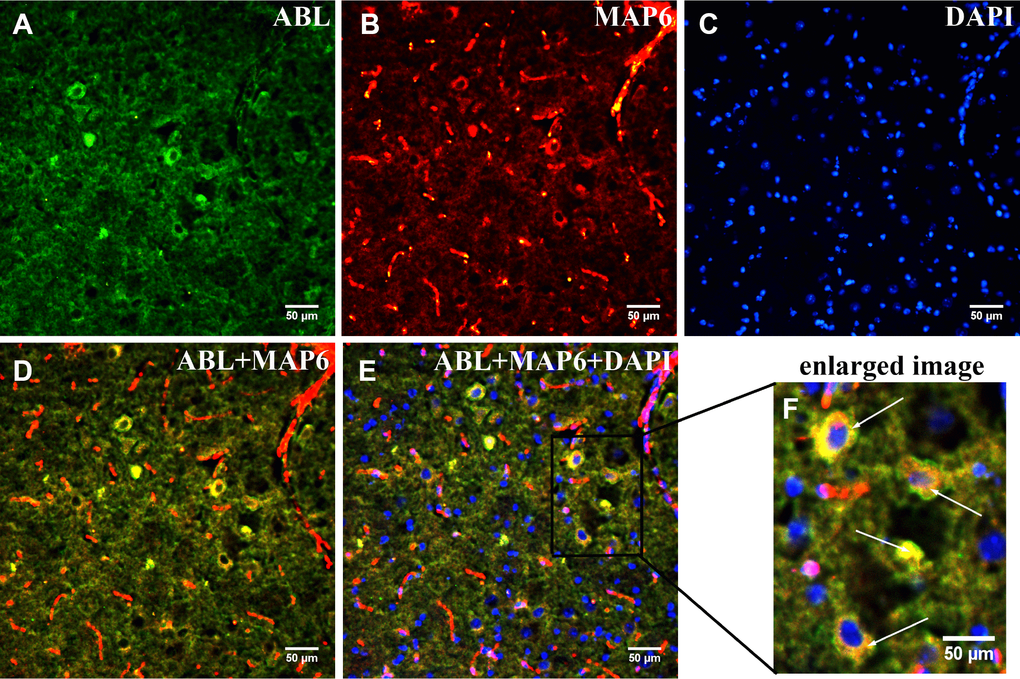
Figure 5.Dual immunofluorescence analysis of MAP6 glycosylation in brainstems from MPTP-induced mice. Photomicrographs show co-localization of MAP6 (A; red) and ABL (B; green). Nuclei are stained with DAPI (blue). Merged images show their colocalization (MAP6+ABL) (C and D; yellow). White arrows point to MAP6 with a glycoprotein. The enlarged image is the boxed part in the merged image.