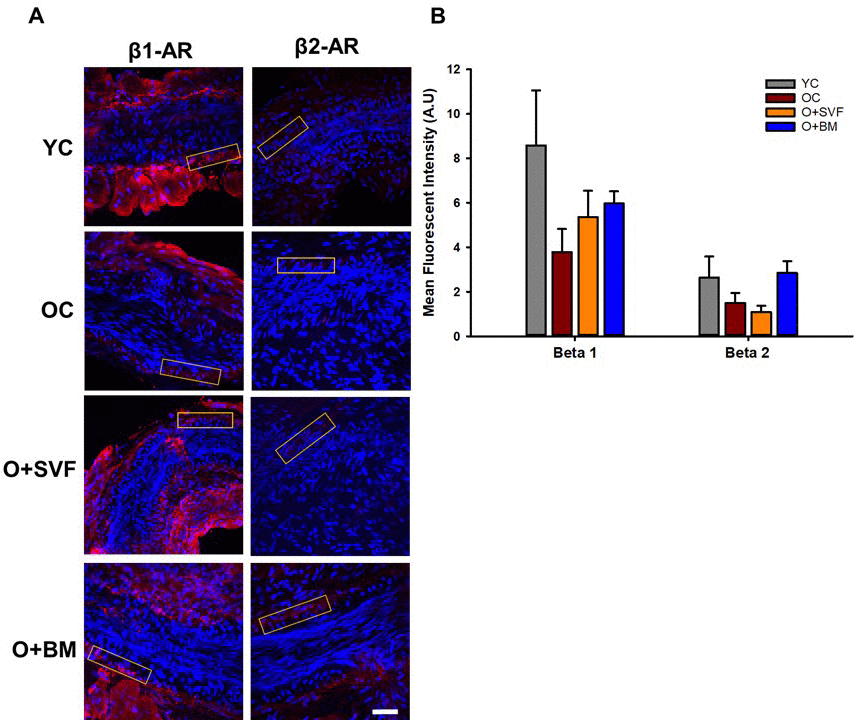
Figure 6.β1- and β2-AR immunofluorescence in isolated coronary arterioles. Representative images with ROI boxes used for fluorescent intensity analysis are shown on isolated coronary arterioles stained for β1- or β2-AR (A). There is no significant difference between the groups in the expression of β1- or β2-AR as measured by quantification of fluorescent intensity (B). Data are represented as means+SEM and analyzed with one-way ANOVA (n≥4). Scale bar is 50 micrometers.