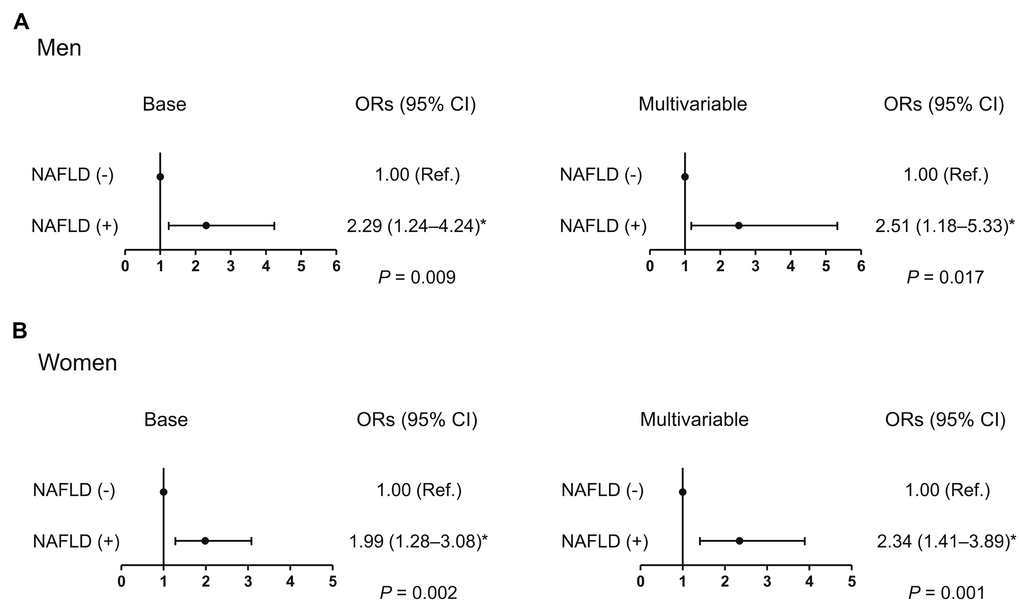
Figure 2.Odds ratio for low muscle strength in the presence of NAFLD. (A) Men and (B) women. *Statistically significant difference from controls. Base model: adjustment for age and weight. Multivariable model: adjustment for age, weight, systolic blood pressure, smoking habit, resistance exercise, total cholesterol, triglycerides, glycated hemoglobin A1c, and alanine aminotransferase. NAFLD, non-alcoholic fatty liver disease; OR, odds ratio; CI, confidence interval.