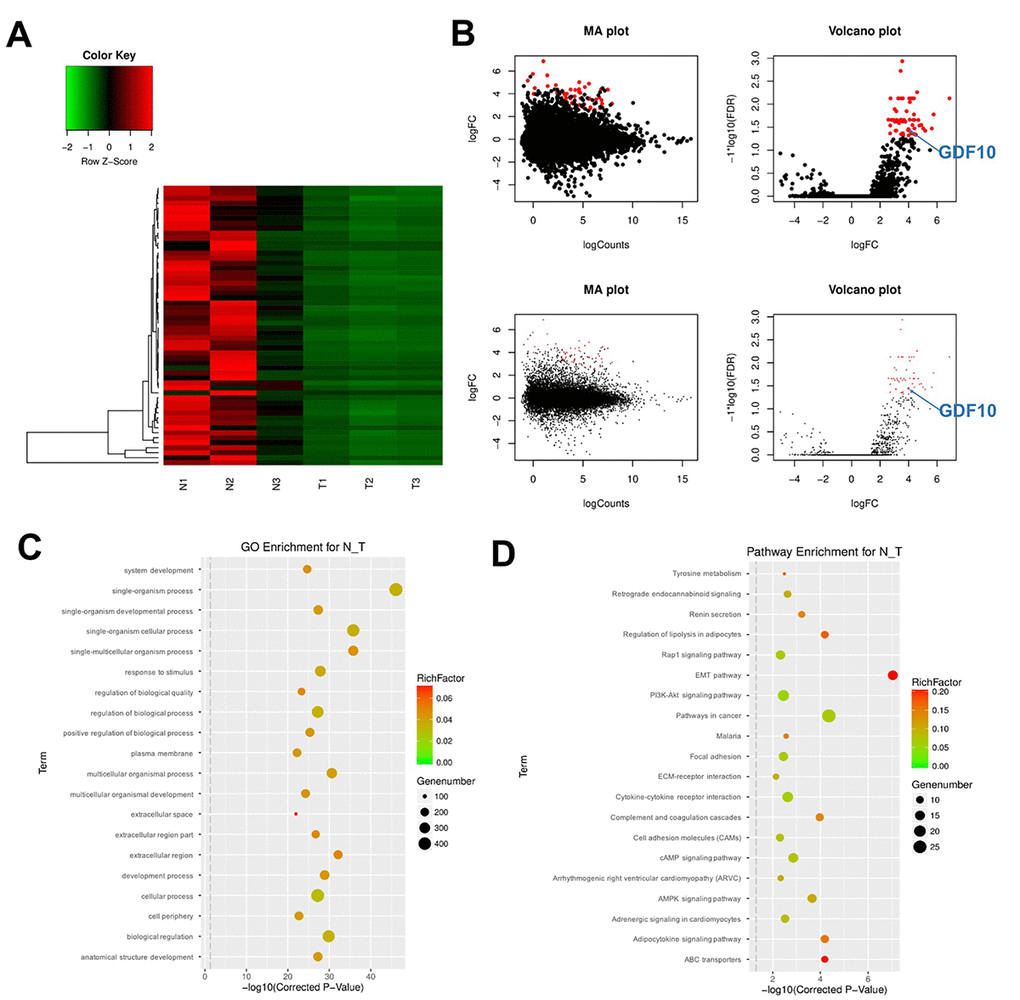
Figure 1.DEG screening in clinical TNBC samples and matched control tissues. (A) Heat Map showing the mRNA expression profiles of TNBC samples and adjacent normal tissues. Values correspond to the different colors representing the fold change (log2 transformed) of each sample. Black stands for 0 (no change in gene expression); red represents upregulation, and green represents downregulation. The distribution of genes with a change in expression of log2 fold-change (FC) ≥ 4 is represented in red in the volcano plot (log2 fold-change versus log FDR). (B) The distribution of genes with a false discovery rate (FDR) < 0.01 is marked in red on the MA plot (log total counts versus log2 fold-change, up panel). The distribution of genes with a change in expression of log2 fold-change (FC) ≥ 4 is represented in red on the volcano plot (log2 fold-change versus log FDR, up panel). (C) Gene ontology (GO) and (D) Kyoto Encyclopedia of Genes and Genomes (KEGG) analysis. Degree of enrichment is shown in the abscissa using corrected p values. Plot colors denote enrichment factor representing the ratio of DEG numbers to the total number of genes in the pathway. N1, N2, N3: normal tissues; T1, T2, T3: TNBC samples.