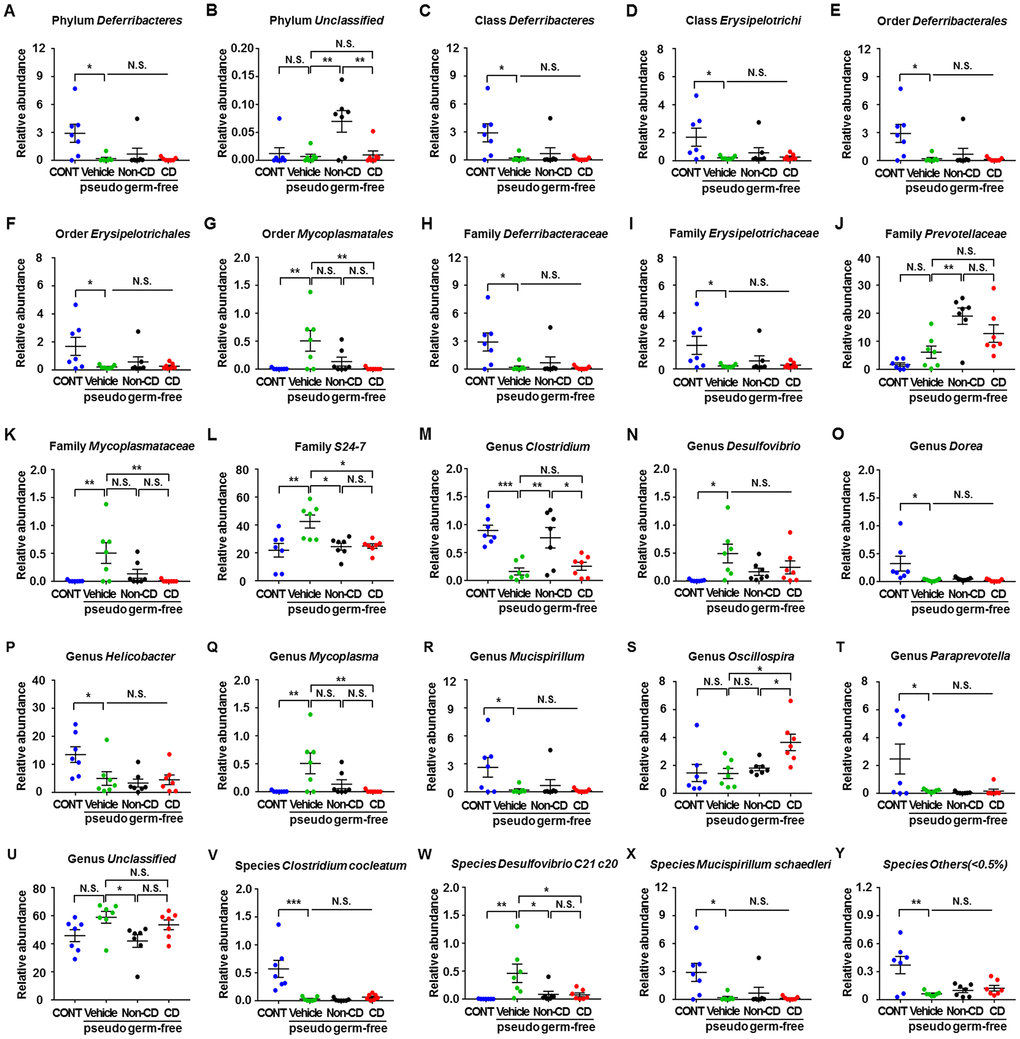
Figure 10.Differences in relative abundance of various gut microbes among pseudo-germ-free mice following transplantation from CD and Non-CD diabetic mice. (A–Y) Relative abundance of (A) phylum Deferribacteres (one-way ANOVA; F3,24 = 5.031, p < 0.01), (B) phylum Unclassified (one-way ANOVA; F3,24 = 6.608, p < 0.01), (C) class Deferribacteres (one-way ANOVA; F3,24 = 5.031, p < 0.01), (D) class Erysipelotrichi (one-way ANOVA; F3,24 = 3.345, p < 0.05), (E) order Deferribacterales (one-way ANOVA; F3,24 = 5.031, p < 0.01), (F) order Erysipelotrichales (one-way ANOVA; F3,24 = 3.345, p < 0.05), (G) order Mycoplasmatales (one-way ANOVA; F3,24 = 5.457, p < 0.01), (H) family Deferribacteraceae (one-way ANOVA; F3,24 = 5.031, p < 0.01), (I) family Erysipelotrichaceae (one-way ANOVA; F3,24 = 3.345, p < 0.05), (J) family Prevotellaceae (one-way ANOVA; F3,24 = 9.825, p < 0.001), (K) family Mycoplasmataceae (one-way ANOVA; F3,24 = 5.457, p < 0.01), (L) family S24-7 (one-way ANOVA; F3,24 = 6.543, p < 0.01), (M) genus Clostridium (one-way ANOVA; F3,24 = 10.32, p < 0.001), (N) genus Desulfovibrio (one-way ANOVA; F3,24 = 3.552, p < 0.05), (O) genus Dorea (one-way ANOVA; F3,24 = 4.82, p < 0.01), (P) genus Helicobacter (one-way ANOVA; F3,24 = 4.677, p < 0.05), (Q) genus Mycoplasma (one-way ANOVA; F3,24 = 5.457, p < 0.01), ® genus Mucispirillum (one-way ANOVA; F3,24 = 3.575, p < 0.05), (S) genus Oscillospira (one-way ANOVA; F3,24 = 5.053, p < 0.01), (T) genus Paraprevotella (one-way ANOVA; F3,24 = 4.656, p < 0.05), (U) genus Unclassified (one-way ANOVA; F3,24 = 3.379, p < 0.05), (V) species Clostridium cocleatum (one-way ANOVA; F3,24 = 12.09, p < 0.001), (W) species Desulfovibrio C21 c20 (one-way ANOVA; F3,24 = 5.486, p < 0.01), (X) species Mucispirillum schaedleri (one-way ANOVA; F3,24 = 3.575, p < 0.05), and (Y) species Others (<0.5%) (one-way ANOVA; F3,24 = 7.748, p < 0.001). Data are shown as mean ± SEM (n = 7 individual samples/group). *P < 0.05, **P < 0.01 or ***P < 0.001. ANOVA: analysis of variance; CD: cognitive dysfunction; CONT: control; N.S.: not significant; SEM: standard error of the mean.