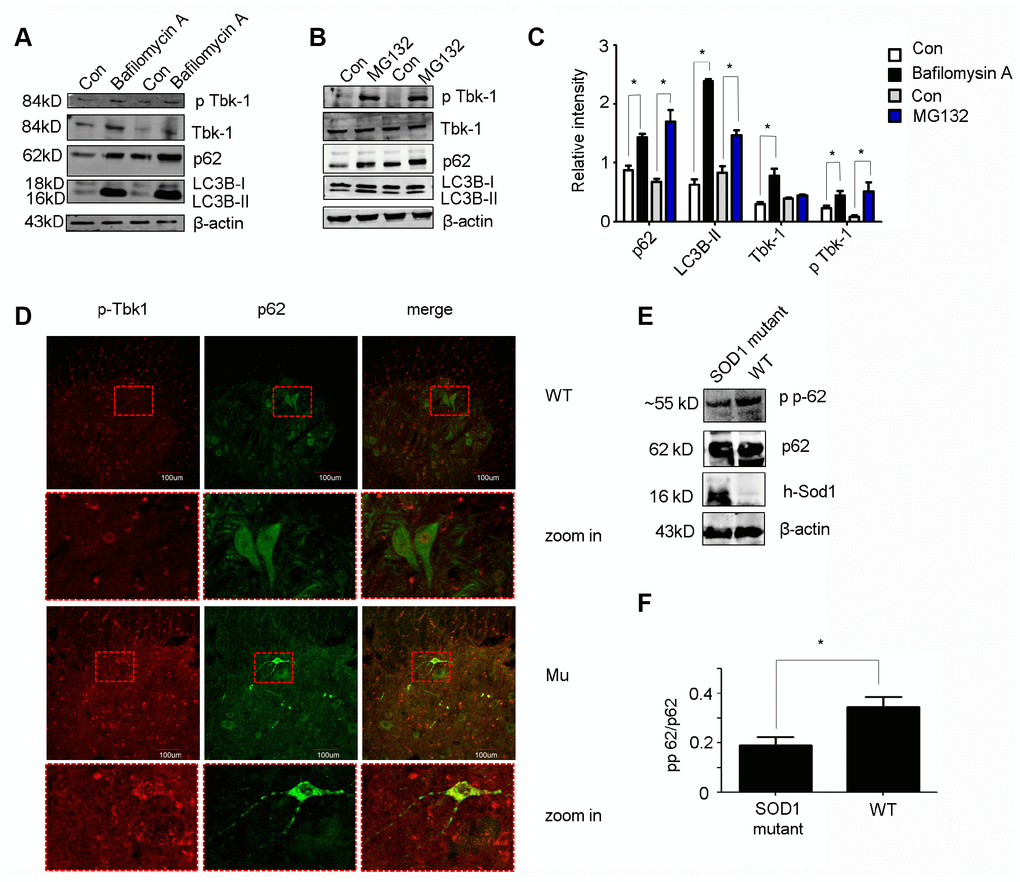
Figure 9.In vitro and in vivo protein expression analyses. (A–C) Western blot analysis of p-Tbk1, total Tbk1, LC3B-II, and p62 in NSC-34 cells treated with bafilomycin A, MG132, or solvent control (Con) (n = 3); *P < 0.05, compared with Con. (D) Double immunofluorescence of p-Tbk1 and p62 in the lumbar spinal cord of SOD1G93A mice and WT littermates. Bar = 100 μm. (E–F) Western blot analysis of p62 phosphorylation status in SOD1 mutant mice and WT controls (n = 3); *P < 0.05, compared to WT mice.