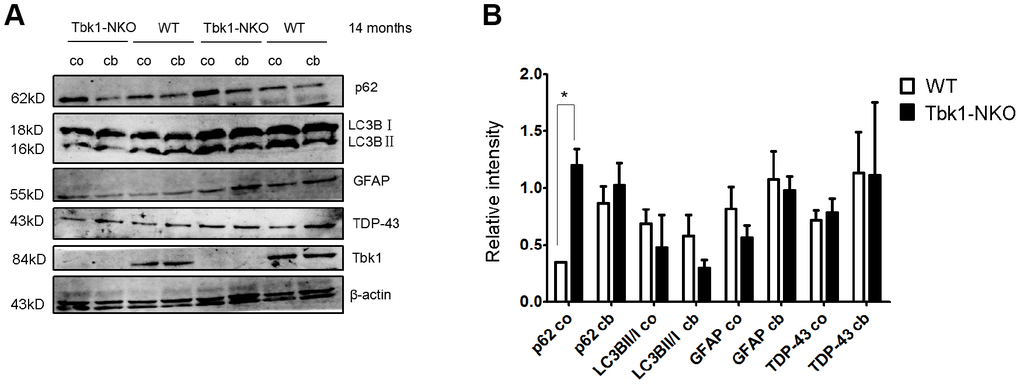
Figure 7.Analysis of autophagy markers. (A–B) Western blot expression analysis of p62, LC3B, GFAP, TDP-43, and Tbk1 in the cortex (co) and cerebellum (cb) of Tbk1-NKO and WT mice (n = 3); *P < 0.05, compared to control mice.
Figure 7 — Deletion of Tbk1 disrupts autophagy and reproduces behavioral and locomotor symptoms of FTD-ALS in mice | Aging