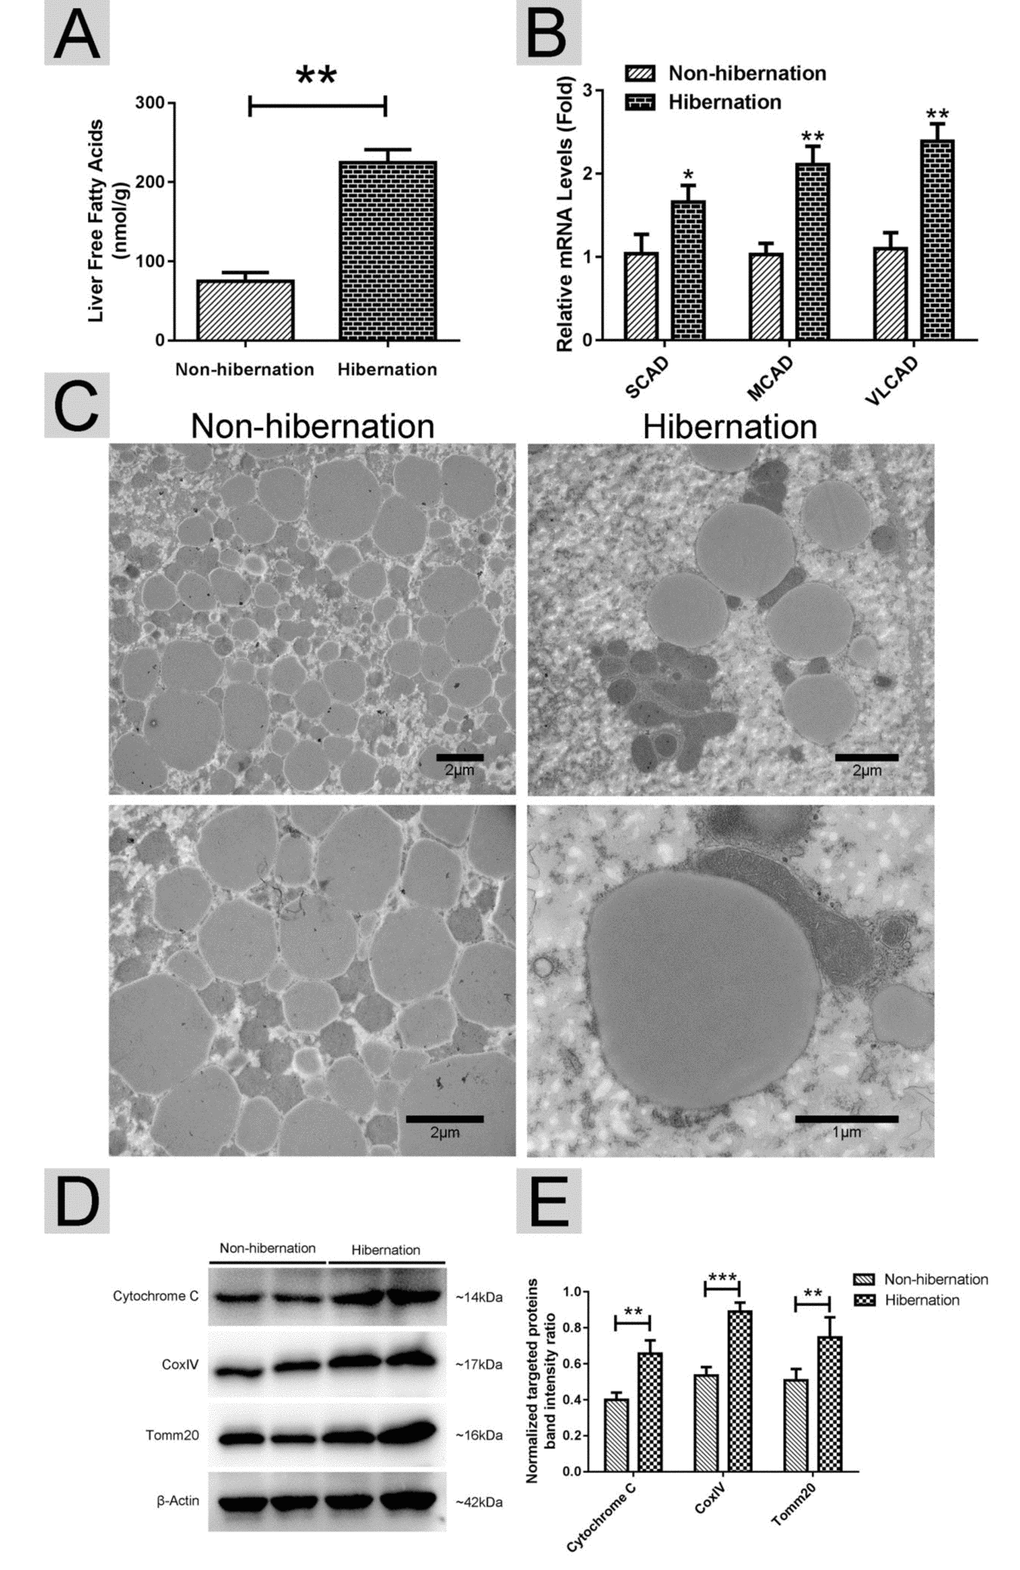
Figure 3.Lipolysis was stimulated during hibernation. (A) Contents of non-esterified free fatty acids (NEFAs) in the liver; (B) The mRNA expression of regulatory enzymes for mitochondrial β-oxidation (SCAD, MCAD and VLCAD); (C) Transmission electron microscopy (TEM) image of hepatocytes; (D) Western blotting analysis of mitochondrial markers (Cytochrome C, Cox IV and Tomm20); (E) Statistics of the western blotting results.