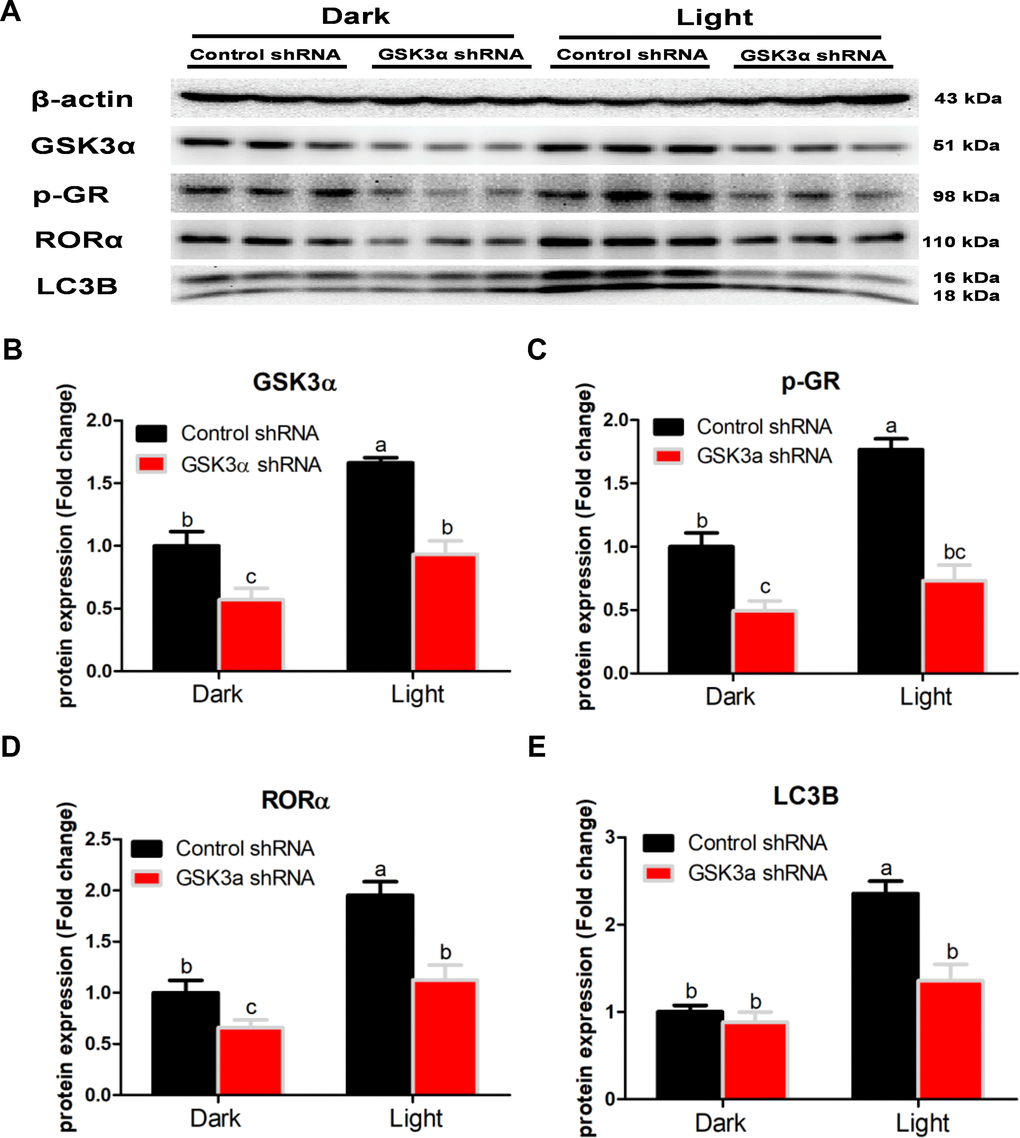
Figure 9.Knockdown of GSK3α significantly suppresses protein content of GSK3α, p-GR, RORα and LC3B in HT-22 cells. (A) Images of bands detected in Western blot analyses; (B) Protein content of GSK3α; (C) Protein content of phospho-GR; (D) Protein content of RORα; (E) Protein content of LC3B. Values are means ± SEM. Bars with different superscripts are significantly different from each other (p < 0.05, n = 3).