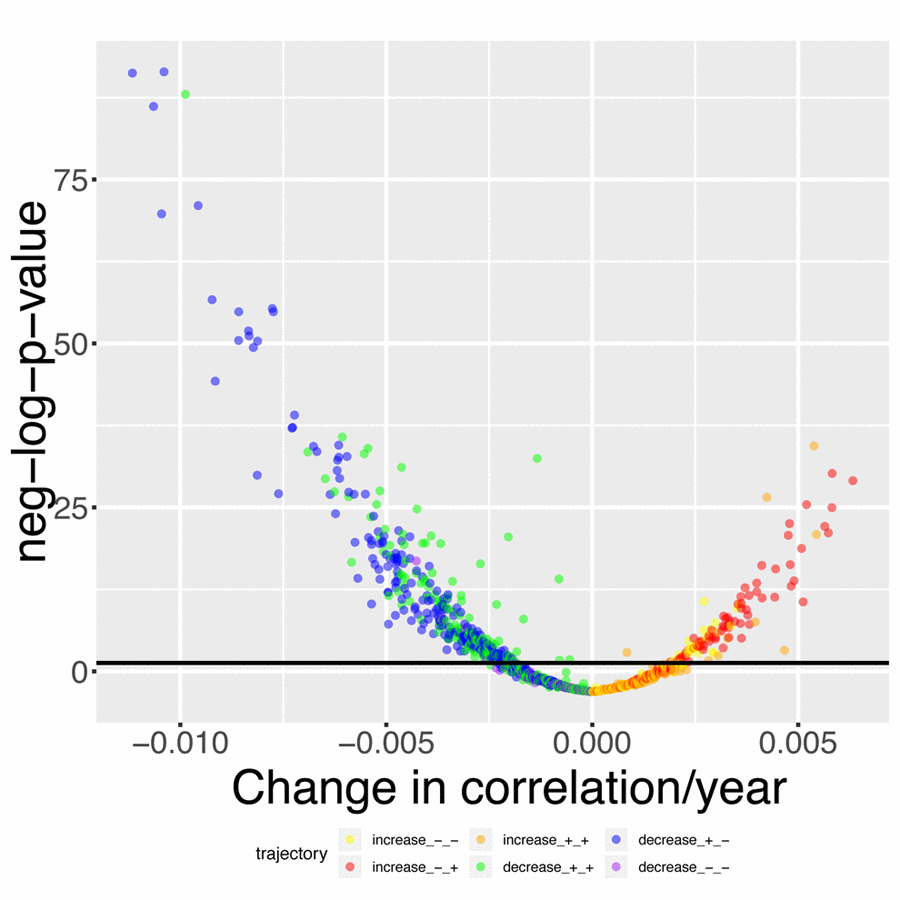
Figure 4.Volcano plot of correlations changes with age. The black horizontal line corresponds to the Bonferroni-corrected significance threshold (0.05). The green dots are correlations that decrease with age but remain positive. The blue dots are correlations that decrease with age, starting positive and ending negative. The purple dots are correlations that decrease with age and remain negative. The yellow plots are correlations that increase with age but remain negative. The red dots are correlations that increase with age, starting negative and ending positive. The orange dots are correlations that increase with age and remain positive.