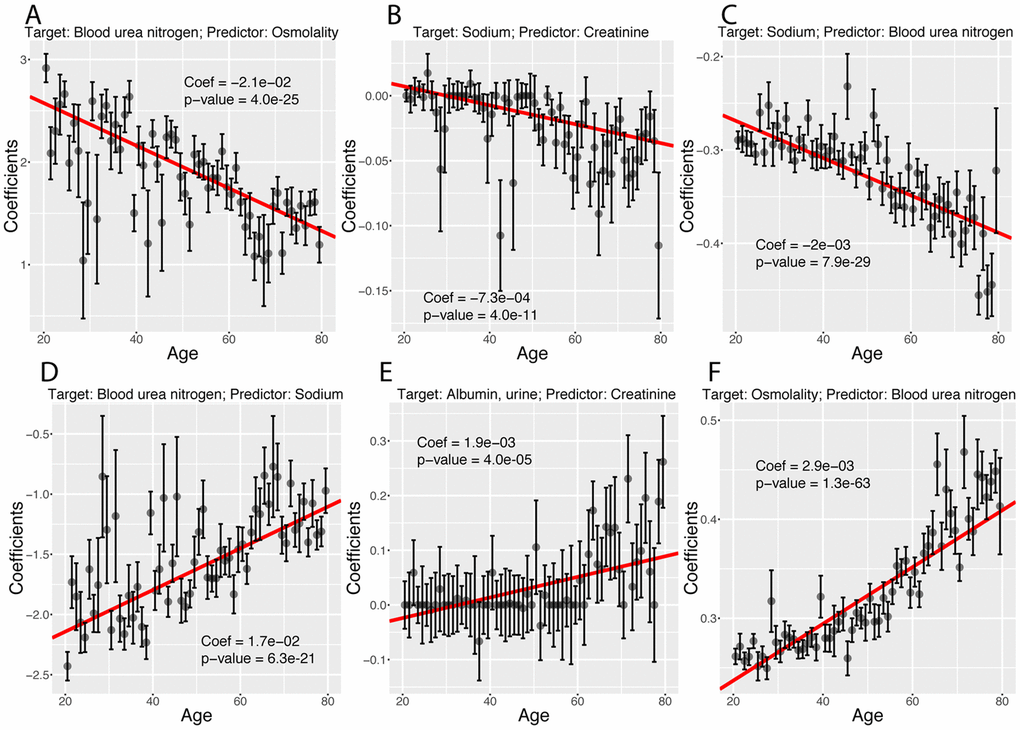
Figure 13.Examples of different trajectories for changes in regression coefficients with age. (A) Target: Blood urea nitrogen. Predictor: Osmolality. Example of a coefficient that decreases with age but remains positive. (B) Target: Sodium. Predictor: Creatinine. Example of a coefficient that decreases with age, starts positive and ends negative. (C)Target: Sodium. Predictor: Blood urea nitrogen. Example of a coefficient that decreases with age and remains negative. (D) Target: Blood urea nitrogen. Predictor: Sodium. Example of a coefficient that increases with age but remains negative. (E) Target: Albumin, urine. Predictor: Creatinine. Example of a coefficient that increases with age, starts negative and ends positive. (F) Target: Osmolality. Predictor: Blood urea nitrogen. Example of a coefficient that increases with age and remains positive.