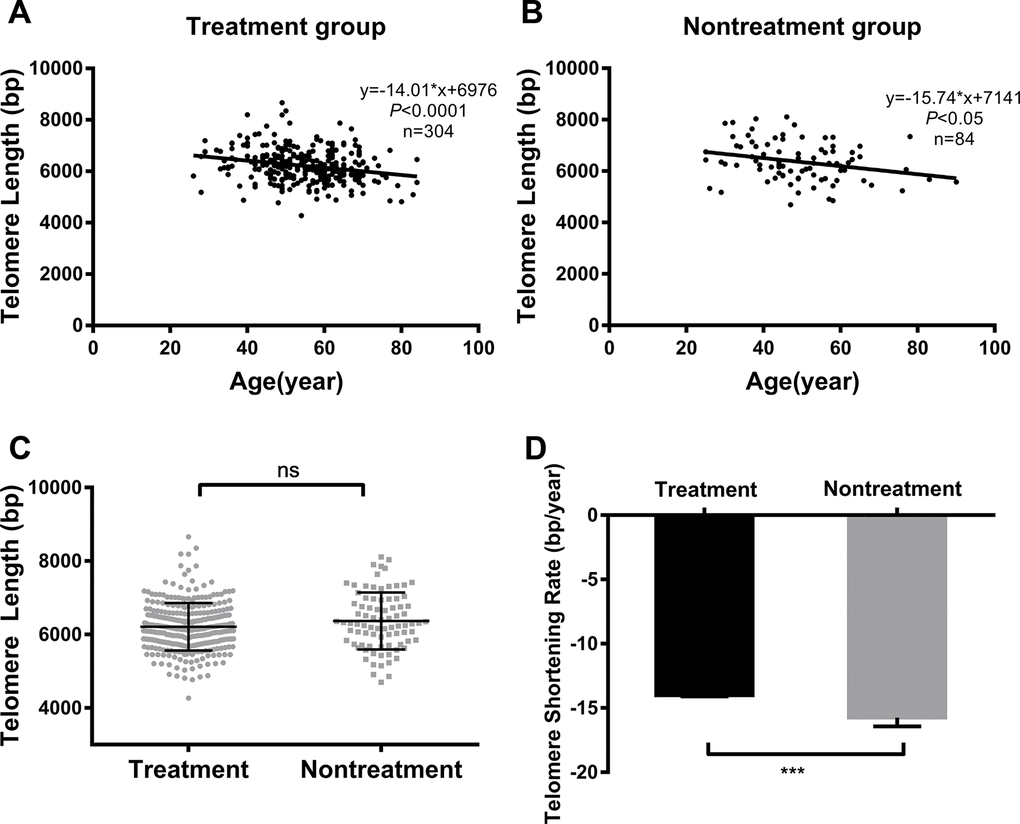
Figure 1.Comparison of telomere length and TSR between treated vs untreated T2DM patients. Linear regression analysis of telomere length and age in the treatment group (A) and nontreatment group (B); comparison of telomere length (C) and TSR (D) between the two groups. Solid lines in A and B indicate mean telomere lengths, calculated by regression analyses; y = -14.01*x+6976 in A (r = -0.24, P < 0.0001) and y = -15.74*x+7141 in B (r = -0.27, P < 0.05). y = telomere length in bp and x = age in years. (D) TSR was found to be -14.01 ± 3.28 bp/year in the treatment group (n = 304) and -15.74 ± 6.21 bp/year in the nontreatment group (n = 84). Telomere length is presented as the mean ± SD. TSRs are presented as the mean ± SEM. ns indicates P > 0.05, ***indicates P < 0.001