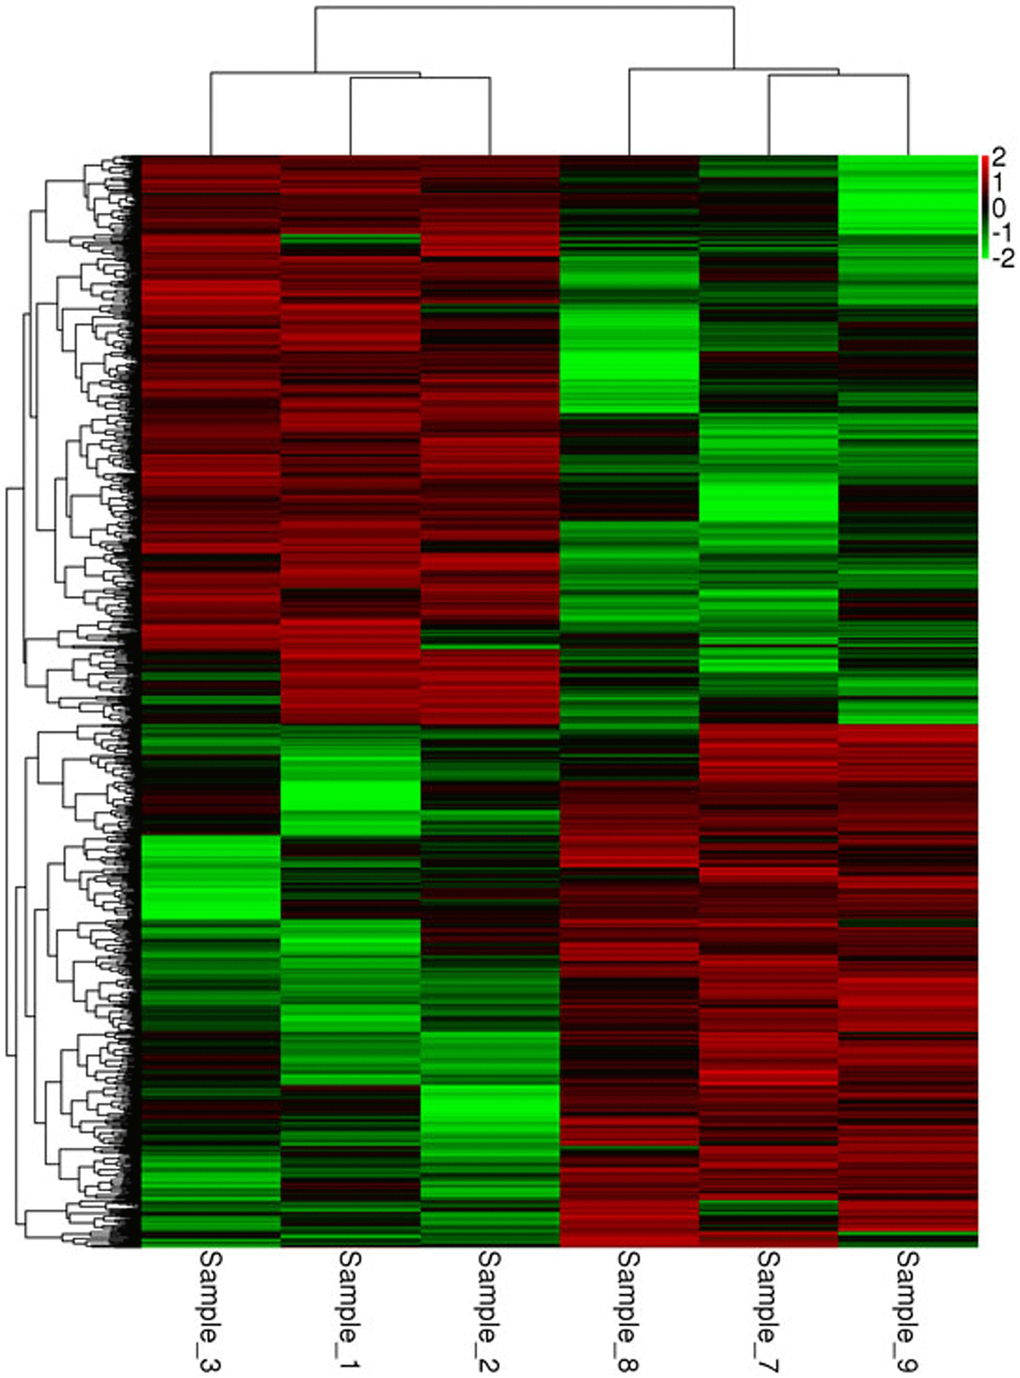
Figure 12.Heat map of the mRNA clustering analysis of macaque mononuclear cells from juvenile and old groupsSamples_1, 2, and 3 correspond to the elderly group, and samples_7, 8, and 9 correspond to the young group. According to the analysis, a total of 5,711 differentially expressed GO terms were identified, of which 2,636 were downregulated and 3,075 were upregulated.