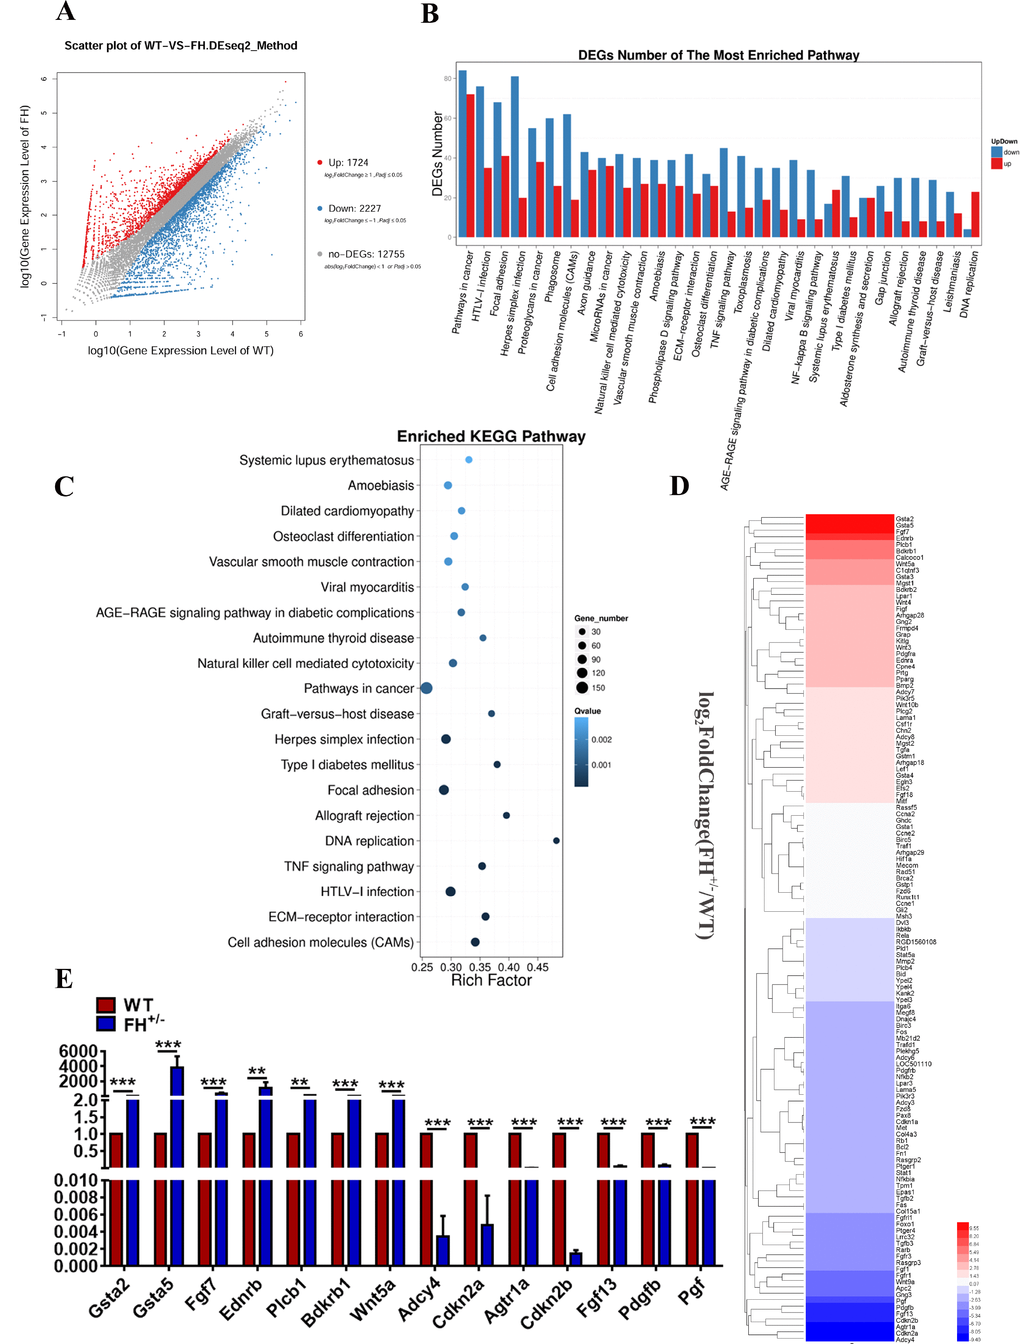
Figure 5.Results of transcriptome sequencing(A) Scatter plots of all expressed genes by BGISEQ-500. Blue represents downregulated genes, red represents upregulated genes and brown represents non-regulated genes. (B) and (C) The results of the pathway function analysis of differentially expressed genes. The up and down of differentially expressed genes is shown in (B), where the X-axis indicates pathway entry, the Y-axis represents the number of genes and up and down for the corresponding pathway entry. (C) The results of differential gene pathway enrichment, where the X-axis represents the enrichment factor and the Y-axis represents the pathway name. (D) Genes of the pathways in cancer. The RT-qPCR validation of the selected DEGs revealed by transcriptome sequencing is shown in (E).