Submit an Article
Navigate
Home
Editorial Board
Editorial Policies
Current Volume
Archive
Scientific Integrity
Publication Ethics Statements
Interviews with Outstanding Authors
Newsroom
Sponsored Conferences
Podcast
Contact
Special Collections
Submit an Article
Online ISSN: 1945-4589
Research Paper
|
Volume 11, Issue 2
|
pp. 501–522
Prognostic value of immune checkpoint molecules in head and neck cancer: a meta-analysis
Back to article
Figure 4
(4 of 5)
−
100%
+
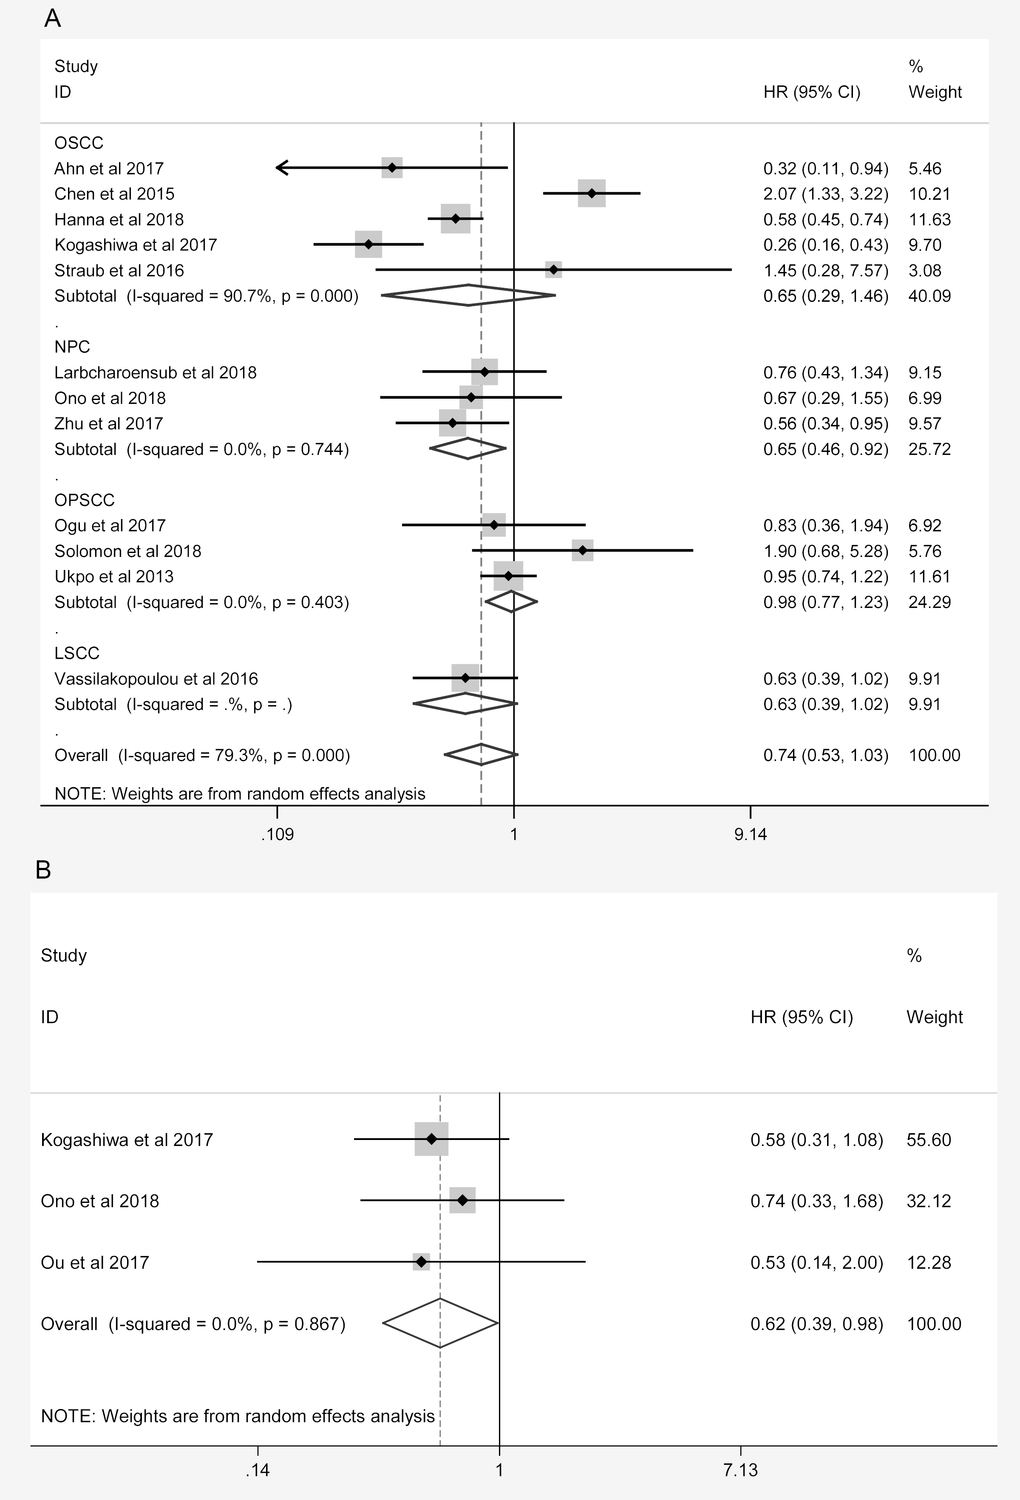
Figure 4.
Overall forest plots of sensitivity analysis.
(
A
) Stratified analysis based on the tumor location for the association between PD-L1 and OS. (
B
) Overall forest plots of sensitivity analysis for the association between PD-L1 and PFS.