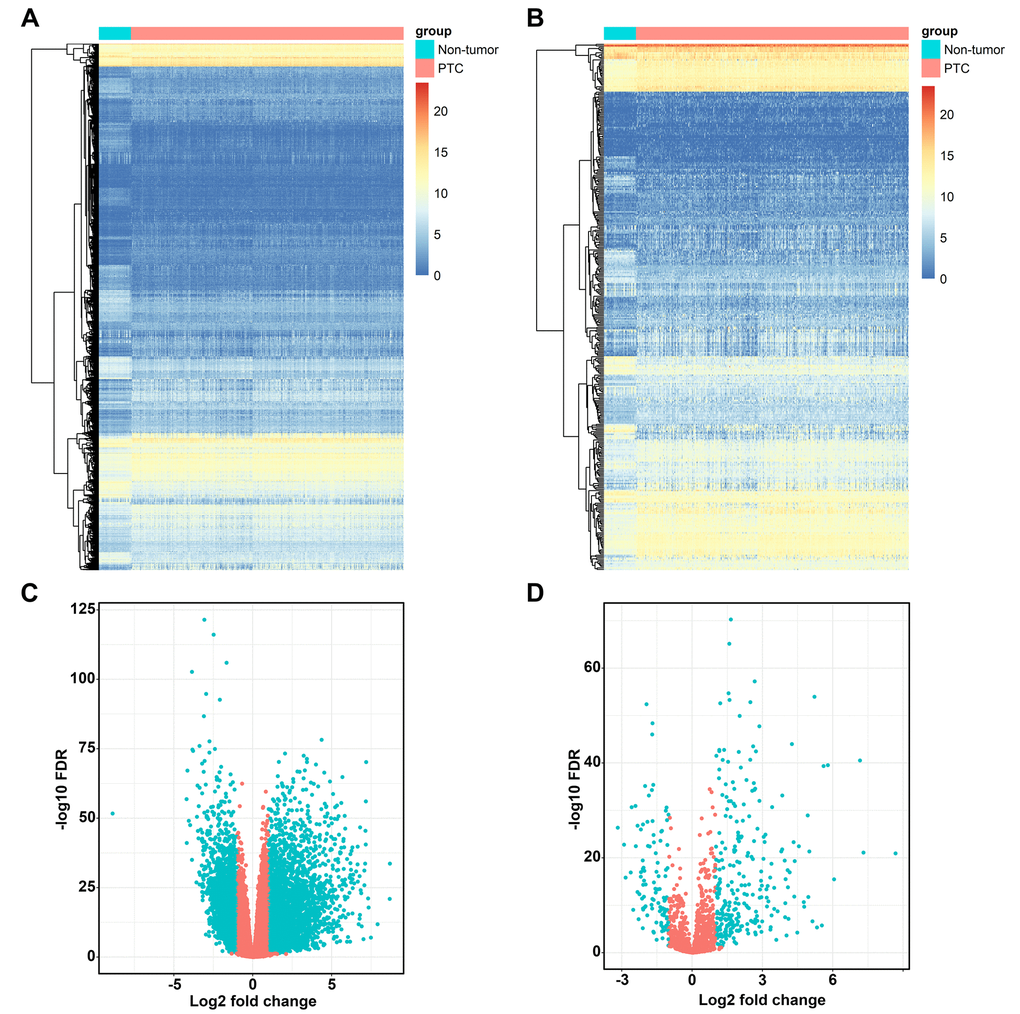
Figure 1.Differentially expressed immune-related genes. Heatmap (A) and volcano plot (C) demonstrating differentially expressed genes between papillary thyroid cancer (PTC) and non-tumor tissues, blue dots represent differentially expressed genes and red dots represent no differentially expressed genes. Differentially expressed immune-related genes (IRGs) are shown in heatmap (B) and volcano plot (D), blue dots represent differentially expressed genes and red dots represent no differentially expressed genes.