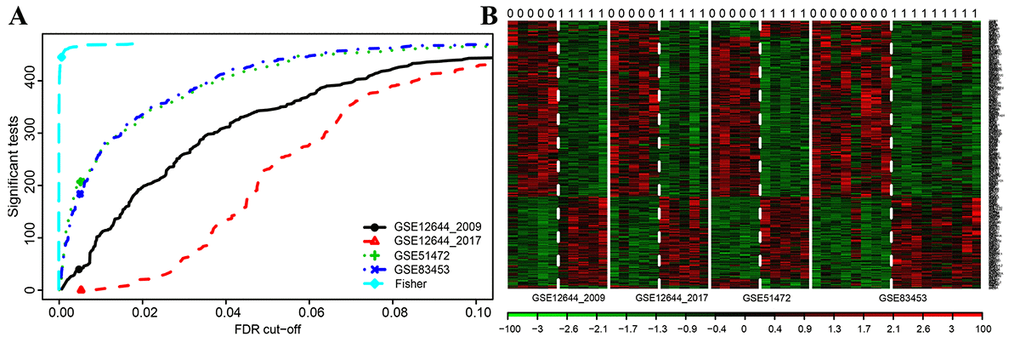
Figure 2.Microarray analysis for DEGs of integrated multiple datasets. (A) Fisher’s method tests the integrated multiple profiles of the shared DEGs’ expression; (B) Integrated heat map of significantly expressed DEGs with each row representing a probe and each column representing a sample. Expression levels are depicted according to the color scale, shown at the bottom. The red color indicated high expressed genes and the blue color indicated low expressed genes, above and below the median, respectively. The magnitude of deviation from the median is represented by the color saturation.