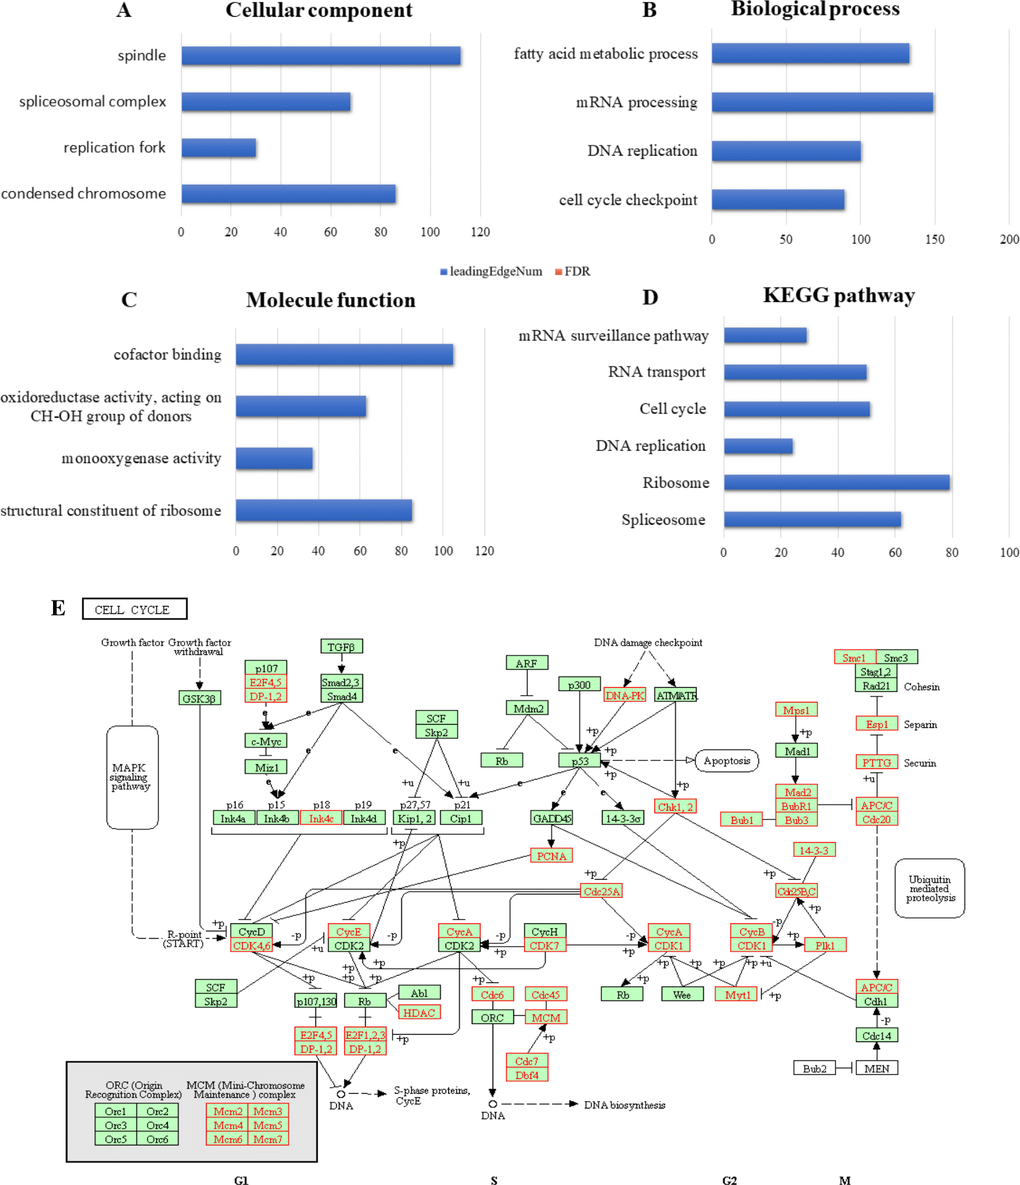
Figure 6.Significantly enriched GO annotations and KEGG pathways of RBM8A in hepatocellular carcinomaThe significantly enriched GO annotations and KEGG pathways of RBM8A co-expression genes in LIHC were analyzed using GSEA. (A) Cellular components. (B) Biological processes. (C) Molecular functions. (D) KEGG pathway analysis. The blue column represents the LeadingEdgeNum, and the orange represents the false discovery rate (FDR). The FDR from GSEA in the figure is 0. (E) KEGG pathway annotations of the cell cycle pathway. Red marked nodes are associated with the LeadingEdgeGene.