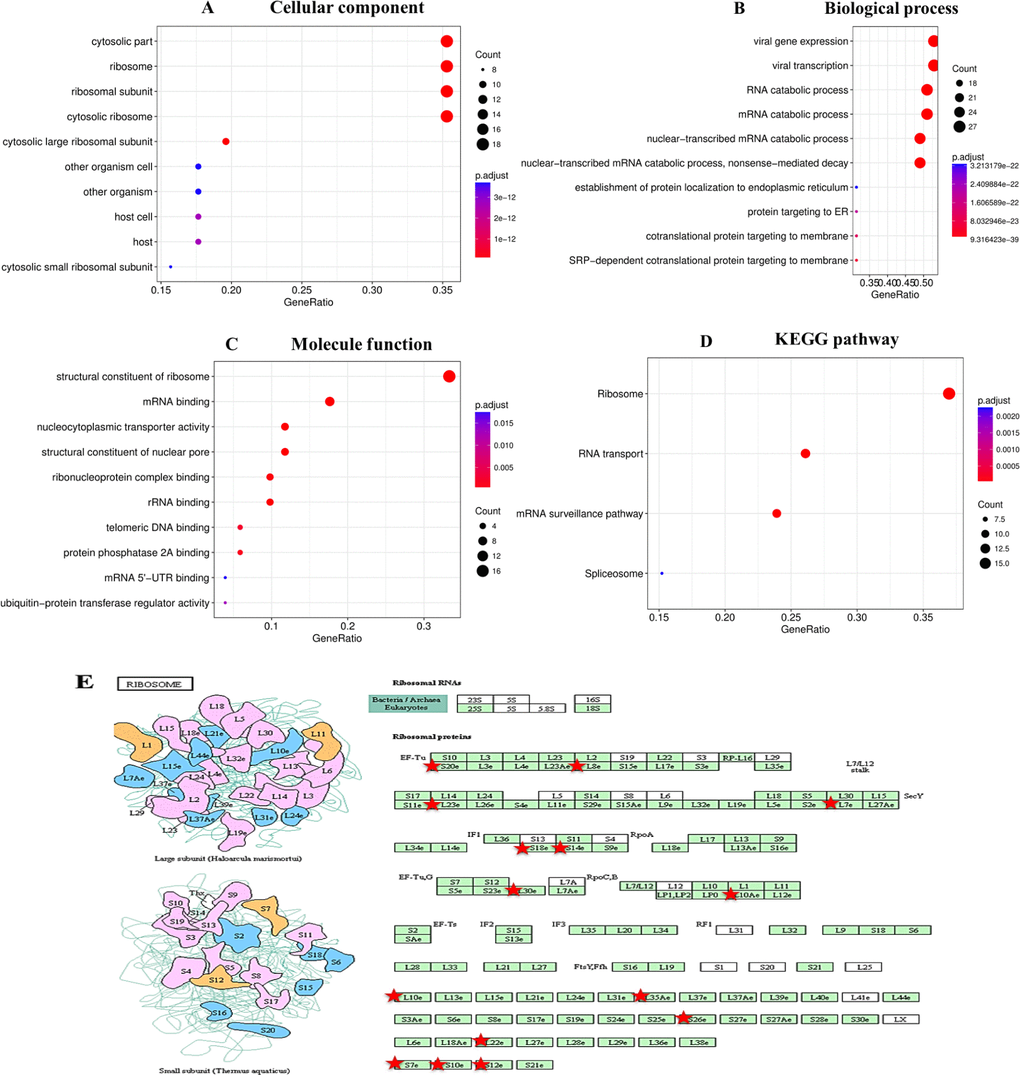
Figure 4.Enrichment analysis of the genes altered in the RBM8A neighborhood in hepatocellular carcinomaThe bubble diagrams display the enrichment results of the top 50 genes altered in the RBM8A neighborhood in LIHC. (A) Cellular components. (B) Biological processes. (C) Molecular functions. (D) KEGG pathway analysis. (E) KEGG pathway annotations of the ribosome pathway. The red star denotes altered genes.