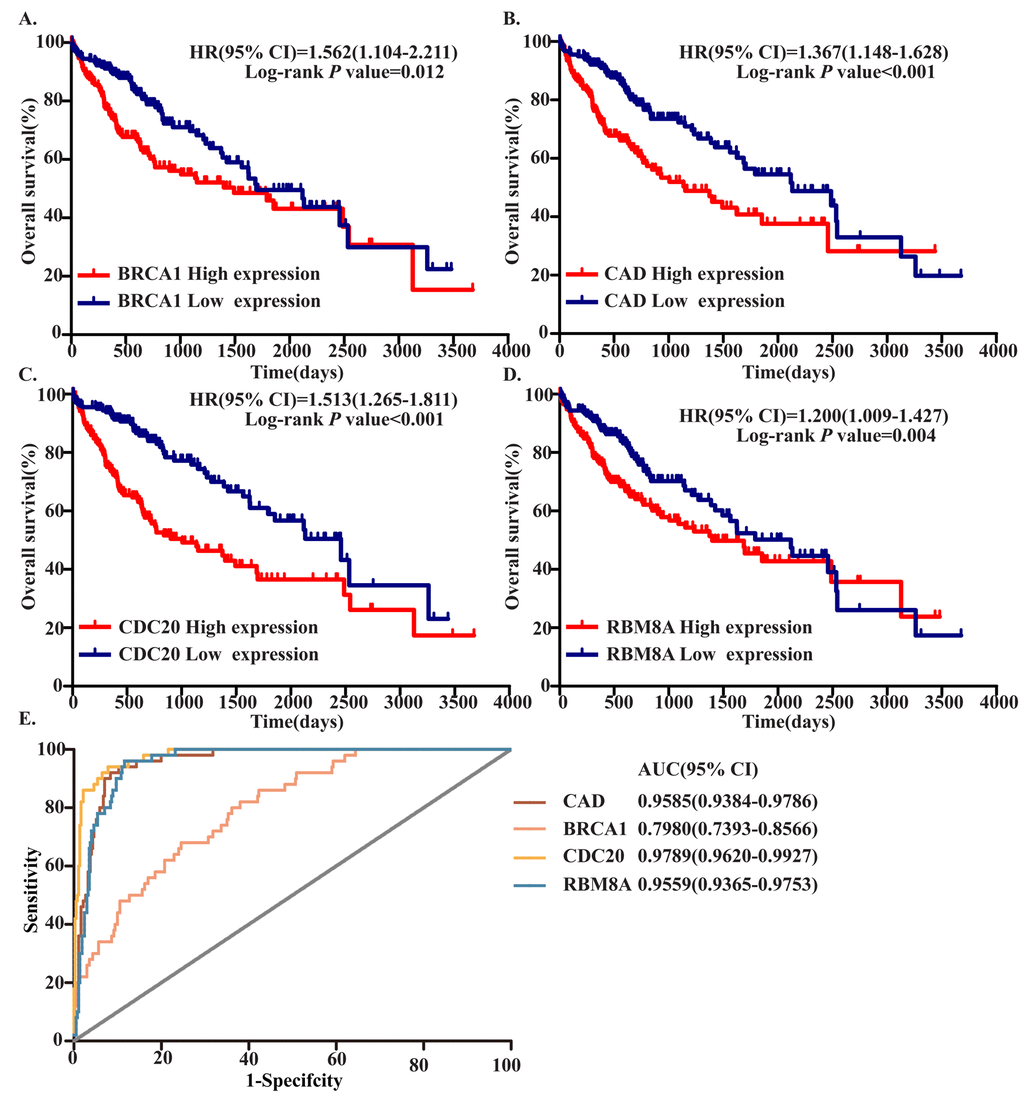
Figure 4.Four hub MDEGs were associated with overall survival in HCC patients by using Kaplan-Meier curve and Log-rank test. The patients were stratified into high expression group and low expression group according to median expression of each mRNA. (A) BRCA1; (B) CAD; (C) CDC20; (D) RBM8A. (E) ROC curves of the 4 hub MDEGs in HCC. The X axis shows false positive rate, presented as "1-Specifcity". The Y axis indicates true positive rate, shown as "Sensitivity".